RATIOS 2021 2020 2019 2018 2017 Key Ratios Debt-to-Equity Ratio 15.2774 36.4745 -118.4352 7.1335 5.2063 Debt Ratio 0.9350 0.9682 0.9977 0.8743 0.8372 Long-term debt to Equity Non-current assets to Net worth 8.1104 19.8482 -70.6943 4.0714 3.2001 10.5717 25.9883 -80.3418 5.5598 4.5996 Capitalization ratio Current liability ratio 0.8902 0.9520 1.0143 0.8028 0.7619 0.4691 0.4558 0.4031 0.4293 0.3853 Liquidity Raio Current ratio 0.8048 0.7028 0.8036 0.8489 0.8069 Quick ratio (acid-test ratio) 0.7420 0.6403 0.7224 0.7905 0.7404 Cash ratio 0.2623 0.1773 0.2152 0.3515 0.3002
Q: Calculate Wiper's debt ratio and debt/equity ratio at December 31, 2020 and 2019. (Round "Debt…
A: Formula: Debt Ratio = Total Liabilities / Total Assets Debt Equity Ratio = Total Liabilities /…
Q: Prepare a statement of cash flows using the indirect method. (
A:
Q: Calculate debt/equity ratio at December 31, 2020 and 2019. WIPER INC. Condensed Balance Sheets…
A: Lets understand the basics. Debt equity ratio indicates how much company's asset is finance through…
Q: 2013 2014 2015 Total debt 1,750 1,900 2,000 Total equity 5,000 4,500 4,000 What conclu sio ns can…
A: Calculate Debt-Equity Ratio as below: Debt-Equity…
Q: Financial Ratios 2018 2019 2020 2021 Sales Growth Rate .97% .952% 1.13% EBIT Margin .81% 8.4% 8.4%…
A: In the accounting cycle, the last stage is the "analysis and interpretation" of the…
Q: Current Year Previous Year Accounts payable 34087 38300 Long-term…
A: Horizontal analysis is prepared to calculate the variance from previous year by showing…
Q: 2015 2016 2017 2018 2019 Return on Assets 5% 3% 4% 2% 5% Return on Equity 2% -1% 0% -3% 0% 0.55x 17…
A: “Since you have posted a many questions, we will solve first question for you. To get the remaining…
Q: Analyse the Assets-to-equity ratio of 1.87 in 2019 and 1.67 in 2020
A: As per Bartleby Honor Code, when multiple questions are asked, the expert is required only to solve…
Q: Determine flev and spread and the non controling interest ratio(in aplicable) show: ROE=[ROA+(FLEV X…
A: Financial Leverage (FLEV) is financial ratio which represents the relationship between the total…
Q: An extract from a printing company's 2021 financial statements. follows: Balance sheet As of…
A: Debt to assets ratio is the ratio of total debt with total assets of the business. It means out of…
Q: Section 1- Financial Analysis FSA Company's Summary Financial Data (In billions, except per share…
A: Common size financial statements are financial statements that are prepared to show each item as a…
Q: please calculate the following: 2017 2018 2019 2020 Net profit margin Gross…
A: Ratio analysis means where different ratio of various years of years companies has been compared and…
Q: RATIOS 2021 2020 2019 2018 2017 Key Ratios Debt-to-Equity Ratio 15.2774 36.4745 -118.4352 7.1335…
A: While the ideal debt-to-equity ratio varies by sector, the general consensus is that it does not…
Q: Required: 1. Calculate the following risk ratios for 2021 and 2022: (Roundy 2021 2022 Receivables…
A: Financial Ratios helps Investors or other users to understand and analysis company Profitability,…
Q: Cost of Debt After-tax cost of debt 4.90% Cost of Equity Treasury Bond Rate…
A: Note: in the given question, for the year 2015, debt weights are assumed to be 24%. As it's given…
Q: explain each ratio of this list what happened in 2019, 2020, 2021? List of Ratios 2019 2020 2021…
A: Gross profit margin: Formula of Gross Profit Margin=(Sales Revenue - Cost of Sales)Sales Revenue*…
Q: ABC Co. financial data for 2020 & 2019 are given below: Total Assets Total Liabilities Cash…
A: Ratio Analysis - Ratio Analysis is the technique used to compare two financial years or two…
Q: Given the ratios for 2020 as follows debtor's collection period=46days stock days on hand=60days…
A:
Q: Liquidity Ratios 2020 2019 Current Ratio 1.06 1.26 P254,511,000| P239,957,000| P248,357,000…
A: 1) Current ratio is decreasing from 1.26 to 1.06 from 2019 to 2020 which shows the liquidity of the…
Q: Analysis of Financial Data (Table with ratios) 2021 Est. 2020 Industry Average Ratio Analysis…
A: A thing that is lent, especially an amount of cash that is supposed to be repaid with interest is…
Q: P4.27 Analyzing Financial Statements. Presented below are selected financial data from the 2018…
A: Ratio analysis is a technique through which an investor is able to analyze the company's financial…
Q: 2018 2019 Short-term solvency ratios a. Current ratio times times b. Quick ratio times times C. Cash…
A: The financial ratio is one of the most important tools for analyzing a company’s financial…
Q: Discuss what the leverage ratios reveal about Starbucks financial health, including any description…
A: Leverage ratio is a financial performance measure. It depicts the amount which has been raised by…
Q: Refer to the data below. Retained earnings, December 31, 2020 $ 416,840 Net decrease…
A:
Q: 2021 Industry Average Ratio Analysis Est. 2020 2019 Liquidity Ratios Current Ratio (times) 4. 2…
A: Liquidity Ratio: It shows how much the enterprise is liquidate or for how much time it can complete…
Q: 2021 Industry Ratio Analysis Est. 2020 2019 Average Liquidity Ratios Current Ratio (times) 4. 2…
A: Market Value ratios are evaluated by potential shareholders to compute whether the price of shares…
Q: Category of industry is real estate. The analysis of Total Debt Ratio is as follows: 2015: 39.73%…
A: Ratio analysis is a tool used by the financial analyst to measure the financial performance of the…
Q: Discuss what the profitablility ratios reveal about Starbucks financial health, including any…
A: Profitability ratios are used by investors and analyst to analyze the ability of a business to…
Q: Price earning ratio: market price per common share/ earning per share 3388/ 42.64= 79.46 (2020…
A: Introduction:- Price-to-Earnings ratio means Price-to-Earnings ratio shows the relationship between…
Q: please calculate the following: 2017 2018 2019 2020 Quick ratio Debt…
A: Ratio Analysis - The ratio is the technique used by the prospective investor or an individual or…
Q: Debt management ratios Total Debt to Total Assets The debt ratio is expressed as Total debt / Total…
A: Debt- It is a type of financing activities which helps the entity in collecting funds from the…
Q: Debt Management Ratio's Trina's Trikes Inc reported a debt to equity ratio of 1.91 times at the end…
A: Debt to equity ratio = 1.91 Total debt = $10,900,000 Total equity = ? Debt to equity ratio means…
Q: alculate EVA from the following data for the year ended 31st March 2017. Average Debt…
A: Economic value added = Net operating Profit after tax - (Capital employed * Weighted average cost of…
Q: 2021 Industry Ratio Analysis Est. 2020 2019 Average Liquidity Ratios Current Ratio (times) 4. 2…
A: Since the question specifically asks for Asset Management and Market Value Ratios, only these ratios…
Q: Below are some of Facebook's financial ratios for fiscal 2020 and fiscal 2019. 2020 2019 Quick Ratio…
A: 1. If the quick ratio is higher then the company's liquidity and financial health are better. If the…
Q: [7] In 2020 the return on assets was 14% and the debt ratio was 40%. Compute the return on equity.…
A: Return on equity (ROE) is the method that measures the rate of return which investors receive on…
Q: PROFITABOLITY: Ratio 2021 2020 2019 ROE= (4,511,706/ 9,414,458) *100 Return on ROE= (2,476,553)/…
A: 1. Return on equity Ratio : This ratio tells that how much a company is able to generate profit from…
Q: THE COMPANY'S FINANCIAL RATIO ANALYSIS a. Liquidity Ratio Liquidity Ratio: Year 2016 2017 2018 2019…
A: Disclaimer: “Since you have asked multiple questions, we will solve the first question for you. If…
Q: a. 2018 current ratio times 2019 current ràtio times b. 2018 Quick ratio times 2019 Quick ratio…
A: The ratios are computed to evaluate the performance of the company. The following ratios are:…
Q: Xyz trading Condensed comparative balance sheet…
A: “Since you have posted a question with multiple sub-parts, we will solve first three sub-parts for…
Q: LIABILITIES 2014 2013 Current liabilities Accounts payable %24 74,305 $ 66,268 Short-term debt 229 $…
A: 2012 Total current liabilities = 66268+165 = 66433 Total liabilities = 66433 + 185073 + 20262 =…
Q: tions of ratios. one paragraph. 3A. Comparison between 2020E and 2019 ratios - (a) Liquidity…
A: Hello. Since your question has multiple sub-parts, we will solve first three sub-parts for you. If…
Q: For Solar Industries and its related but separate financing company Solar Financing Corp. Required:…
A: Debt to equity ratio = Total Debt/ Total Equity
Q: 2019 2019 Ratio Nordstrom Kohl's Working Capital -$290 $1,880 Current Ratio 0.92 1.68 Quick Ratio…
A: Ratio Analysis:- This helps in comparing the performance of two or more companies on the basis of…
Q: 2021 2020 2019 2018 2017 Current Ratio 0.95 times 1.3 times 1.1 times 1.2 times 1.3 times Days in…
A: The question is related to Ratio Analysis. The ratio are given for five years from 2017 to 2021. The…
Q: Times Interest Earned Ratio
A: Times Interest Earned Ratio = Operating income/Interest expense
Q: 2018 2019 2020 Income before depreciation, amortization, interest, and taxes $1,598 $2,832 $3,618…
A: Formula: Debt to equity ratio = Total debts / Total shareholders equity Net debt as a percentage of…
Q: Balance Sheet Data Assets 2019 2018 2017 Liabilities 2019 2018 2017 Cash & C.E. Acct. Rec…
A: Common size analysis is a tool which is used by managers to evaluate the percentage of various…
Q: Bruno Inc.'s Financial Statement for years 2014-2015. Compute for the Bruno Inc. Year 2015 Debt to…
A: Financial ratios are those which provide a summary of the accounts of a company and helps an…
Indicate the meaning of the ratios computed, is the busiiness performing good or bad?
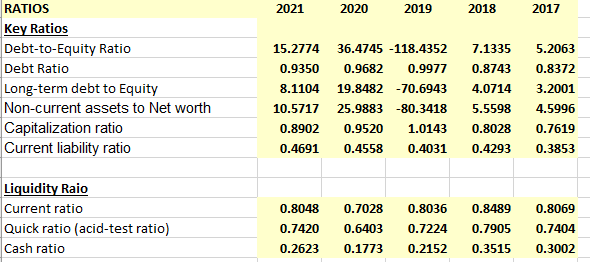
Step by step
Solved in 3 steps
- Question 1. WACC Cost of Debt After-tax cost of debt 4.90% Cost of Equity Treasury Bond Rate (risk free rate) 5% Beta 0.48 Risk premium 7% Years 2014 2015 2016 2017 Capital Structure Debt 22% 25% 28% 27% Equity 78% 75% 72% 73% Please calculate following for each of the year from 2014 to 2017 Cost of Debt (before tax) Cost of Equity WACC (Weighted Average Cost of Capital)Calculate the Weighted Average Cost of Capital (WACC) Cost of Equity = 11.02% Cost of Debt = 5.35% Debt-to-Equity Ratio = 15.52%WACC 2021: WACC= (Cost of equity x Equity Weight) + (Cost of debt x Debt Weight) WACC= (6.59% x 59,61%) +(3.50% x 40.39%) WACC=5,34 WACC 2020: WACC= (Cost of equity x Equity Weight) + (Cost of debt x Debt Weight) WACC= (5.20% x 52.30%) +(2.79% x 50.39%) WACC=2,7 1) Critically explain the WACC result of Toyota.
- Q18 If the company’s EBIT is OMR 500,000; market value of the equity is OMR 2,000,000 and value of Debt is OMR 4,000,000; then what is the overall cost of capital of the firm under Net Income Approach? a. 12.5% b. 10% c. 25% d. 8.33%Return on Capital Employed (ROCE) = For Riccarton PLC: ROCE = 50000/380000 X 100 = 13.2% For Edinburgh PLC: ROCE = 45000/230000 X 100 = 19.6% Current Ratio = Current assets/current liabilities For Riccarton PLC: Current ratio = 150/120 = 1.25 For Edinburgh PLC: Current ratio = 80/70 = 1.14 Gearing Ratio = (long term borrowing + short term borrowings) / equity For Riccarton PLC: Gearing ratio = (180 + 100)/200 = 1.4 For Edinburgh PLC: Gearing ratio = (100 + 50)/130 = 1.15 Price/Earnings (P/E) Ratio = Share price / earnings per share For Riccarton PLC: P/E Ratio = 195/35 =5.57 For Edinburgh PLC: P/E Ratio = 451/28 = 16.107 Based on the above ratios explain, which company George H. and James W. should invest in. You should also briefly discuss the limitations of your analysis.Can you explain the information below market value added (MVA) analysis and interpretation of results below. Market Value of Equity:$133,341,000,000.00 Plus: Market Value of Debt:$13,677,000.00 Equals: Market Value of Firm:$133,354,677,000.00 Minus: Total Invested Capital:($1,944,100.00) Equals: MVA$133,356,621,100.00
- Calculate WACC from following data. Risk free rate 1.63% total debt $78.93 billion Market Cap $2580 billion Beta 0.86 Corporate Bond rate 3.10% CAPM S&P historical return 5.90% Tax Rate 21% please show stepsFIN320 (DuPont analysis) Garwryk, Inc., which is financed with debt and equity, presently has a debt ratio of percent. What is the firm's equity multiplier? How is the equity multiplier related to the firm's use of debt financing (i.e., if the firm increased its use of debt financing would this increase or decrease its equity multiplier)? Explain. What is the firm's equity multiplier? The equity multiplier is given by: equity multiplier = 1/1-DEBT RATIO The equity multiplier is___. (Round to two decimal places.) How is the equity multiplier related to the firm's use of debt financing (i.e., if the firm increased its use of debt financing would this increase or decrease its equity multiplier)? Explain. (Select the best choice below.) A. If the company decreases its debt financing it will increase its debt ratio, therefore it will increase its equity multiplier. B. If the company increases its debt financing it will increase its debt ratio, therefore it will…Cost of Debt After-tax cost of debt 4.90% Cost of Equity Treasury Bond Rate (risk free rate) 5% Beta 0.48 Risk premium 7% Years 2014 2015 2016 2017 Capital Structure Debt 22% 25% 28% 27% Equity 78% 76% 72% 73% Please calculate following for each of the year from 2014 to 2017:3 1. Cost of Debt (before tax) 2. Cost of Equity 3. WACC (Weighted Average Cost of Capital)
- which one is correct please confirm? Q24: In determining the cost of debt, several factors must be considered. All of the following are those factors EXCEPT ____. a. flotation costs b. the firm’s growth rate of dividends c. the firm’s before-tax cost of debt d. the firm’s tax rateCalculate the cost of equity with the CAPM Calculate the cost od debt based on what the company is currently paying for its debt - Beta of the industry = 1.16 - Equity Risk Premium = 6.97% - Risk-free rate = 3.77% - Objective capital structure of the industry = 13.24%P4 The fraction of a firm’s total financing that is represented by debt is a measure of its: efficiency. financial leverage. operating leverage. financial security.