tions of ratios. one paragraph. 3A. Comparison between 2020E and 2019 ratios - (a) Liquidity ratios (1) What happened? Did each of the ratios increase, decrease, or not change? (2) What had caused the movement or non-movement for each ratio? and (3) Is this a good thing or a bad thing for the company? (b) Solvency ratios (1) What happened? Did each of the ratios increase, decr


Compose a financial analysis based on your evaluation of the ratios. For EACH of the five (5) classifications of ratios. one paragraph.
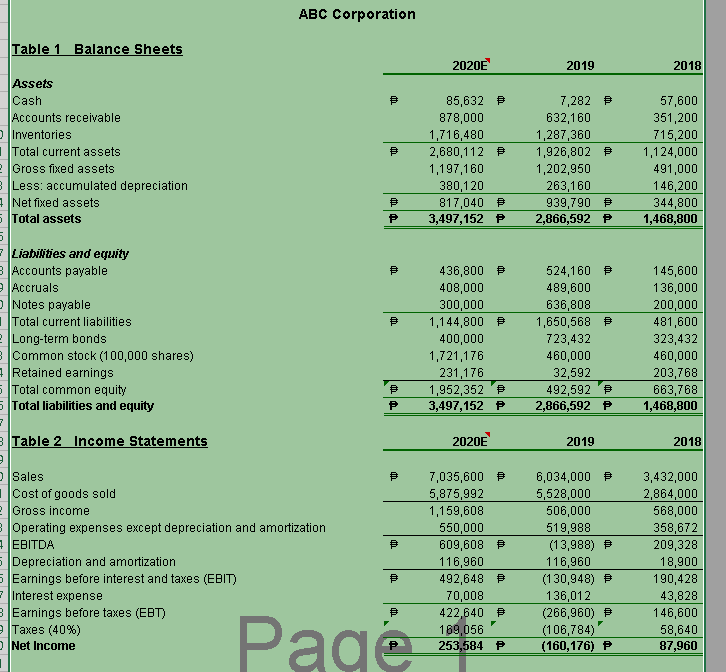
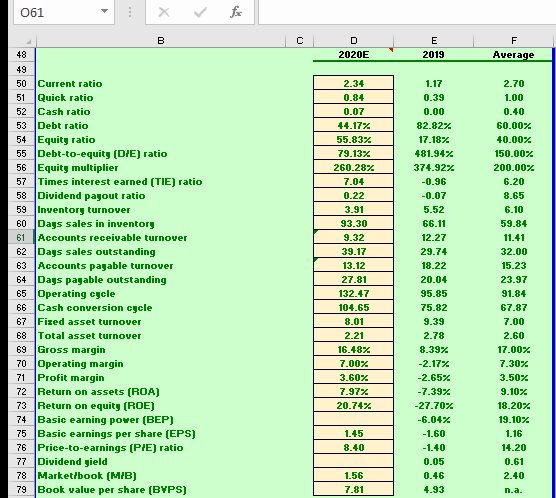
3A. Comparison between 2020E and 2019 ratios -
(a) Liquidity ratios
(1) What happened? Did each of the ratios increase, decrease, or not change?
(2) What had caused the movement or non-movement for each ratio? and
(3) Is this a good thing or a bad thing for the company?
(b) Solvency ratios
(1) What happened? Did each of the ratios increase, decrease, or not change?
(2) What had caused the movement or non-movement for each ratio? and
(3) Is this a good thing or a bad thing for the company?
(c) Asset utilization ratios
(1) What happened? Did each of the ratios increase, decrease, or not change?
(2) What had caused the movement or non-movement for each ratio? and
(3) Is this a good thing or a bad thing for the company?
(d) Profitability ratios
(1) What happened? Did each of the ratios increase, decrease, or not change?
(2) What had caused the movement or non-movement for each ratio? and
(3) Is this a good thing or a bad thing for the company?
(e) Market performance ratios)
(1) What happened? Did each of the ratios increase, decrease, or not change?
(2) What had caused the movement or non-movement for each ratio? and
(3) Is this a good thing or a bad thing for the company?


Trending now
This is a popular solution!

Step by step
Solved in 2 steps with 1 images


