Refer Excel Output and answer the following questions. 1. Determine whether there is a significant relationship between dependent variable and the two independent variables at the 0.05 level of significance. 2. At the 0.05 level of significance, determine whether each independent variable makes a significant contribution to the regression model. (use critical value T stat Approach)
Refer Excel Output and answer the following questions. 1. Determine whether there is a significant relationship between dependent variable and the two independent variables at the 0.05 level of significance. 2. At the 0.05 level of significance, determine whether each independent variable makes a significant contribution to the regression model. (use critical value T stat Approach)

Big Ideas Math A Bridge To Success Algebra 1: Student Edition 2015
1st Edition
ISBN:9781680331141
Author:HOUGHTON MIFFLIN HARCOURT
Publisher:HOUGHTON MIFFLIN HARCOURT
Chapter11: Data Analysis And Displays
Section11.4: Two-ways Tables
Problem 12E

Related questions
Question
Refer Excel Output and answer the following questions.
1. Determine whether there is a significant relationship between dependent variable and the two independent variables at the 0.05 level of significance.
2. At the 0.05 level of significance, determine whether each independent variable makes a significant contribution to the regression model. (use critical value T stat Approach)
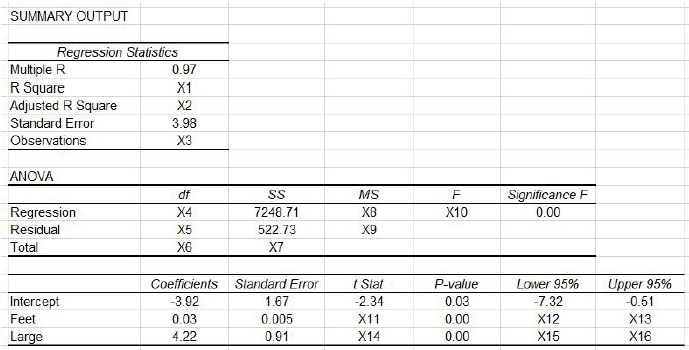
Transcribed Image Text:SUMMARY OUTPUT
Regression Statistics
Multiple R
R Square
Adjusted R Square
Standard Error
0.97
X1
X2
3.98
Observations
X3
ANOVA
df
MS
Significance F
Regression
Residual
X4
7248.71
X8
X10
0.00
X5
522.73
X9
Total
X6
X7
Upper 95%
-0.51
Coefficients
Standard Error
t Stat
P-value
Lower 95%
Intercept
-3.92
1.67
-2.34
0.03
-7.32
Feet
0.03
0.005
X11
0.00
X12
X13
Large
4.22
0.91
X14
0.00
X15
X16
Expert Solution
This question has been solved!
Explore an expertly crafted, step-by-step solution for a thorough understanding of key concepts.

This is a popular solution!

Trending now
This is a popular solution!

Step by step
Solved in 4 steps

Knowledge Booster


Learn more about
Need a deep-dive on the concept behind this application? Look no further. Learn more about this topic, statistics and related others by exploring similar questions and additional content below.Recommended textbooks for you
Big Ideas Math A Bridge To Success Algebra 1: Stu…
Algebra
ISBN:
9781680331141
Author:
HOUGHTON MIFFLIN HARCOURT
Publisher:
Houghton Mifflin Harcourt

Linear Algebra: A Modern Introduction
Algebra
ISBN:
9781285463247
Author:
David Poole
Publisher:
Cengage Learning
Big Ideas Math A Bridge To Success Algebra 1: Stu…
Algebra
ISBN:
9781680331141
Author:
HOUGHTON MIFFLIN HARCOURT
Publisher:
Houghton Mifflin Harcourt
Linear Algebra: A Modern Introduction
Algebra
ISBN:
9781285463247
Author:
David Poole
Publisher:
Cengage Learning