Refer to Figure 5.1. On the graph that shows total costs, what is the level of variable costs when 6 units are produced? 550 500 450 400 350 300 8 250 200 150 100 50 T T 1 5 6 Quantity Figure 5.2 O a. $50 O b. $100 O. $400 O d. $500 Total Cost
Refer to Figure 5.1. On the graph that shows total costs, what is the level of variable costs when 6 units are produced? 550 500 450 400 350 300 8 250 200 150 100 50 T T 1 5 6 Quantity Figure 5.2 O a. $50 O b. $100 O. $400 O d. $500 Total Cost

Principles of Economics 2e
2nd Edition
ISBN:9781947172364
Author:Steven A. Greenlaw; David Shapiro
Publisher:Steven A. Greenlaw; David Shapiro
Chapter7: Production, Costs, And Industry Structure
Section: Chapter Questions
Problem 23RQ: Which costs are measured on per-unit basis: fixed costs, average cost, avenge variable cost,...

Related questions
Question
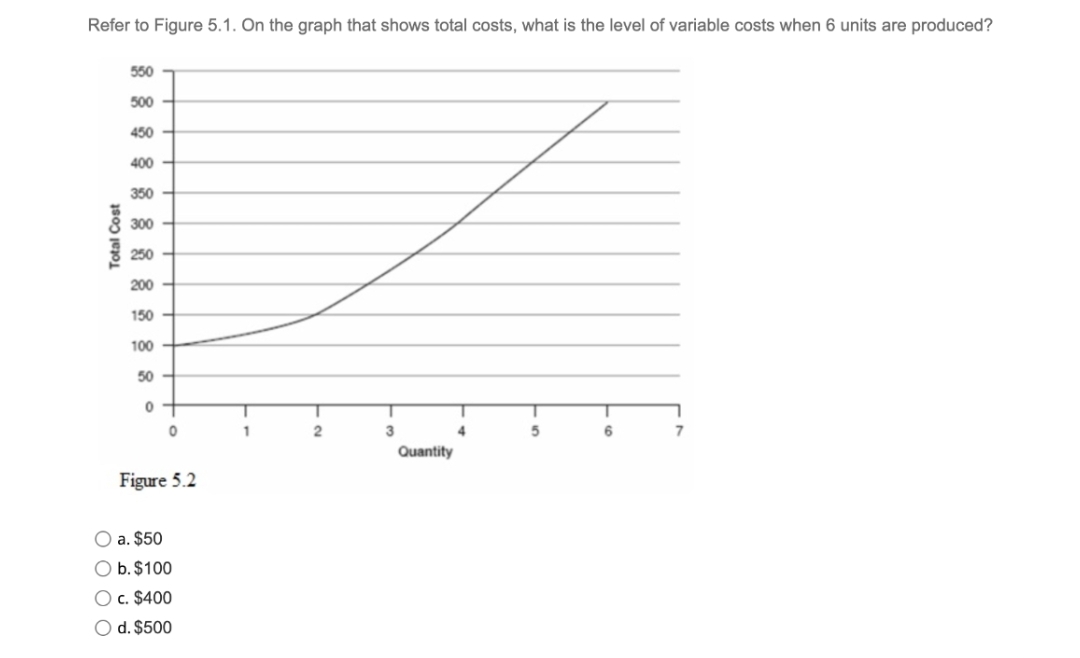
Transcribed Image Text:Refer to Figure 5.1. On the graph that shows total costs, what is the level of variable costs when 6 units are produced?
550
500
450
400
350
300
250
200
150
100
50
T
1
3
4
5
7
Quantity
Figure 5.2
O a. $50
O b. $100
O c. $400
O d. $500
Total Cost
Expert Solution
This question has been solved!
Explore an expertly crafted, step-by-step solution for a thorough understanding of key concepts.

This is a popular solution!

Trending now
This is a popular solution!

Step by step
Solved in 2 steps

Recommended textbooks for you
Principles of Economics 2e
Economics
ISBN:
9781947172364
Author:
Steven A. Greenlaw; David Shapiro
Publisher:
OpenStax


Principles of Economics 2e
Economics
ISBN:
9781947172364
Author:
Steven A. Greenlaw; David Shapiro
Publisher:
OpenStax

Essentials of Economics (MindTap Course List)
Economics
ISBN:
9781337091992
Author:
N. Gregory Mankiw
Publisher:
Cengage Learning

Principles of Economics, 7th Edition (MindTap Cou…
Economics
ISBN:
9781285165875
Author:
N. Gregory Mankiw
Publisher:
Cengage Learning

Principles of Economics (MindTap Course List)
Economics
ISBN:
9781305585126
Author:
N. Gregory Mankiw
Publisher:
Cengage Learning