Regression analysis is a statistical technique that fits a line to observed data points so that the resulting equation can be used to forecast other data points. It is useful in excess capacity and economies of scale situations. Economies of scale occur when the ratio of asset to sales will change as the size of the firm increases. Regression analysis can lead to improved financial forecasts and better information which can be used to improve management's actions. Quantitative Problem: Jasper Jewelry has $140 million in sales. The company expects that its sales will increase 6% this year. Jasper's CFO uses a simple linear regression to forecast the company's inventory level for a given level of projected sales. On the basis relationship between inventories and sales (in millions of dollars) is as follows: recent history, the estimated Inventories - $9 + 0.09(Sales) Given the estimated sales forecast and the estimated relationship between inventories and sales, what is your forecast of the company's year-end inventory level? Enter your answer in millions. For example, an answer of $10,550,000 should be entered as 10.55. Do not round intermediate calculations. Round your answer to two decimal places. million
Regression analysis is a statistical technique that fits a line to observed data points so that the resulting equation can be used to forecast other data points. It is useful in excess capacity and economies of scale situations. Economies of scale occur when the ratio of asset to sales will change as the size of the firm increases. Regression analysis can lead to improved financial forecasts and better information which can be used to improve management's actions. Quantitative Problem: Jasper Jewelry has $140 million in sales. The company expects that its sales will increase 6% this year. Jasper's CFO uses a simple linear regression to forecast the company's inventory level for a given level of projected sales. On the basis relationship between inventories and sales (in millions of dollars) is as follows: recent history, the estimated Inventories - $9 + 0.09(Sales) Given the estimated sales forecast and the estimated relationship between inventories and sales, what is your forecast of the company's year-end inventory level? Enter your answer in millions. For example, an answer of $10,550,000 should be entered as 10.55. Do not round intermediate calculations. Round your answer to two decimal places. million

Managerial Economics: Applications, Strategies and Tactics (MindTap Course List)
14th Edition
ISBN:9781305506381
Author:James R. McGuigan, R. Charles Moyer, Frederick H.deB. Harris
Publisher:James R. McGuigan, R. Charles Moyer, Frederick H.deB. Harris
Chapter4A: Problems In Applying The Linear Regression Model
Section: Chapter Questions
Problem 2E

Related questions
Question
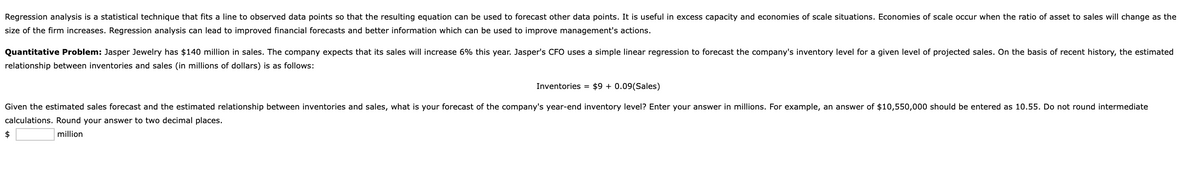
Transcribed Image Text:Regression analysis is a statistical technique that fits a line to observed data points so that the resulting equation can be used to forecast other data points. It is useful in excess capacity and economies of scale situations. Economies of scale occur when the ratio of asset to sales will change as the
size of the firm increases. Regression analysis can lead to improved financial forecasts and better information which can be used to improve management's actions.
Quantitative Problem: Jasper Jewelry has $140 million in sales. The company expects that its sales will increase 6% this year. Jasper's CFO uses a simple linear regression to forecast the company's inventory level for a given level of projected sales. On the basis of recent history, the estimated
relationship between inventories and sales (in millions of dollars) is as follows:
Inventories = $9 + 0.09(Sales)
Given the estimated sales forecast and the estimated relationship between inventories and sales, what is your forecast of the company's year-end inventory level? Enter your answer in millions. For example, an answer of $10,550,000 should be entered as 10.55. Do not round intermediate
calculations. Round your answer to two decimal places.
2$
million
Expert Solution
This question has been solved!
Explore an expertly crafted, step-by-step solution for a thorough understanding of key concepts.

This is a popular solution!

Trending now
This is a popular solution!

Step by step
Solved in 2 steps with 2 images

Knowledge Booster


Learn more about
Need a deep-dive on the concept behind this application? Look no further. Learn more about this topic, economics and related others by exploring similar questions and additional content below.Recommended textbooks for you
Managerial Economics: Applications, Strategies an…
Economics
ISBN:
9781305506381
Author:
James R. McGuigan, R. Charles Moyer, Frederick H.deB. Harris
Publisher:
Cengage Learning
Managerial Economics: Applications, Strategies an…
Economics
ISBN:
9781305506381
Author:
James R. McGuigan, R. Charles Moyer, Frederick H.deB. Harris
Publisher:
Cengage Learning