Water is being poured into a large, cone-shaped cistern. The volume of water, measured in cm³, is reported at different time intervals, measured in seconds. A regression analysis was completed and is displayed in the computer output. Regression Analysis: cuberoot (Volume) versus Time Predictor Coef SE Coef P Constant -0.006 0.00017 -35.294 0.000 Time 0.640 0.000018 35512.6 0.000 s-0.030 R-Sq=1.000 R-aq (adj)-1.000 What is the equation of the least-squares regression line? Volume = 0.640 - 0.006(Time)
Water is being poured into a large, cone-shaped cistern. The volume of water, measured in cm³, is reported at different time intervals, measured in seconds. A regression analysis was completed and is displayed in the computer output. Regression Analysis: cuberoot (Volume) versus Time Predictor Coef SE Coef P Constant -0.006 0.00017 -35.294 0.000 Time 0.640 0.000018 35512.6 0.000 s-0.030 R-Sq=1.000 R-aq (adj)-1.000 What is the equation of the least-squares regression line? Volume = 0.640 - 0.006(Time)

Managerial Economics: Applications, Strategies and Tactics (MindTap Course List)
14th Edition
ISBN:9781305506381
Author:James R. McGuigan, R. Charles Moyer, Frederick H.deB. Harris
Publisher:James R. McGuigan, R. Charles Moyer, Frederick H.deB. Harris
Chapter4A: Problems In Applying The Linear Regression Model
Section: Chapter Questions
Problem 2E

Related questions
Question
100%
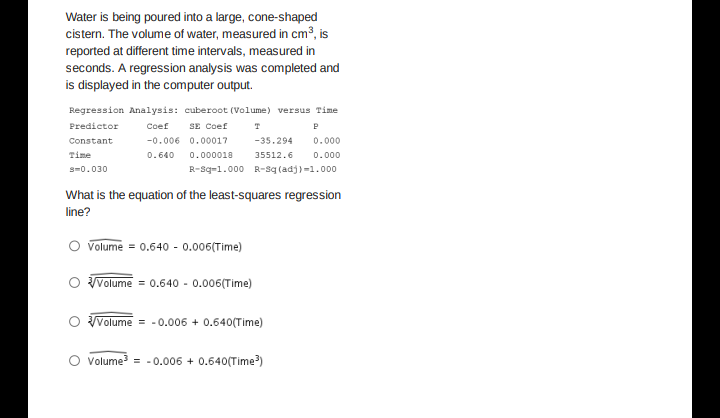
Transcribed Image Text:Water is being poured into a large, cone-shaped
cistern. The volume of water, measured in cm³, is
reported at different time intervals, measured in
seconds. A regression analysis was completed and
is displayed in the computer output.
Regression Analysis: cuberoot (Volume) versus Time
Predictor
Coef
SE Coef
Constant
-0.006 0.00017
-35.294
0.000
Time
0.640
0.000018
35512.6
0.000
s=0.030
R-Sq=1.000 R-sq (adj)=1.000
What is the equation of the least-squares regression
line?
Volume = 0.640 - 0.006(Time)
Volume = 0.640 - 0.006(Time)
Volume = -0.006 + 0.640(Time)
Volume = - 0.006 + 0.640(Time?)
Expert Solution
This question has been solved!
Explore an expertly crafted, step-by-step solution for a thorough understanding of key concepts.

This is a popular solution!

Trending now
This is a popular solution!

Step by step
Solved in 2 steps with 1 images

Knowledge Booster


Learn more about
Need a deep-dive on the concept behind this application? Look no further. Learn more about this topic, economics and related others by exploring similar questions and additional content below.Recommended textbooks for you
Managerial Economics: Applications, Strategies an…
Economics
ISBN:
9781305506381
Author:
James R. McGuigan, R. Charles Moyer, Frederick H.deB. Harris
Publisher:
Cengage Learning
Managerial Economics: Applications, Strategies an…
Economics
ISBN:
9781305506381
Author:
James R. McGuigan, R. Charles Moyer, Frederick H.deB. Harris
Publisher:
Cengage Learning