SAT before class 1010 1010 840 1020 1000 950 1110 SAT after class 1020 1040 830 1010 1030 980 1140 Use the sample data shown above to decide whether the mean SAT score increases after taking an SAT class. Use a = 0.10. For correct grading, use d = before - after. 1. The population distribution requirement for this test is: O Need a normally distributed population O None needed The hypotheses are: O Ho:µ1 2 p2; Ha: µ1 < p2 %3D O Ho: 1 = 42; Ha: µ1 42 0 < Prt :0 > Prt O 0> Prt :0 Z Prl O O Ho: H S H2; Ha: u1 > 42 2. This is a CO rightO leftO two tailed test and the test used is a: O Paired T-Test (dependent populations) O2-Sample T-Test (independent populations) O2-Sample Z-Test (independent populations) The Degrees of Freedom (If needed, use the simple estimate discussed in the notes, not the messy formula) are
SAT before class 1010 1010 840 1020 1000 950 1110 SAT after class 1020 1040 830 1010 1030 980 1140 Use the sample data shown above to decide whether the mean SAT score increases after taking an SAT class. Use a = 0.10. For correct grading, use d = before - after. 1. The population distribution requirement for this test is: O Need a normally distributed population O None needed The hypotheses are: O Ho:µ1 2 p2; Ha: µ1 < p2 %3D O Ho: 1 = 42; Ha: µ1 42 0 < Prt :0 > Prt O 0> Prt :0 Z Prl O O Ho: H S H2; Ha: u1 > 42 2. This is a CO rightO leftO two tailed test and the test used is a: O Paired T-Test (dependent populations) O2-Sample T-Test (independent populations) O2-Sample Z-Test (independent populations) The Degrees of Freedom (If needed, use the simple estimate discussed in the notes, not the messy formula) are

Glencoe Algebra 1, Student Edition, 9780079039897, 0079039898, 2018
18th Edition
ISBN:9780079039897
Author:Carter
Publisher:Carter
Chapter10: Statistics
Section10.4: Distributions Of Data
Problem 19PFA

Related questions
Topic Video
Question
100%
Transcribed Image Text:• Question 10
>
SAT before class
1010
1010
840
1020
1000
950
1110
SAT after class
1020
1040
830
1010
1030
980
1140
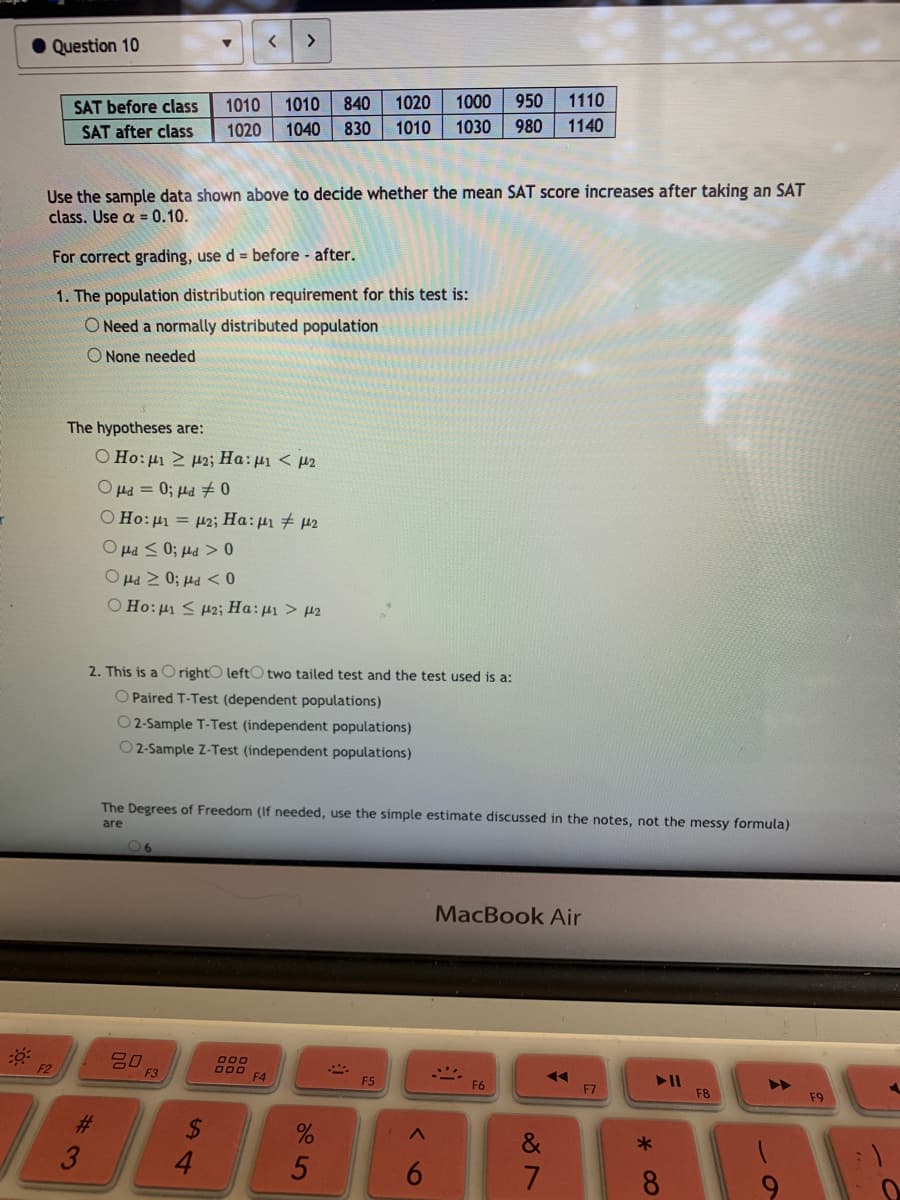
Use the sample data shown above to decide whether the mean SAT score increases after taking an SAT
class. Use a =0.10.
For correct grading, use d = before - after.
1. The population distribution requirement for this test is:
O Need a normally distributed population
O None needed
The hypotheses are:
O Ho: µ1 2 p2; Ha: µ1 < p2
0 Prf 0 = Prl O
O Ho: µ = 42; Ha:u1 + p2
0 < Prl :0 > Pri O
0 > Prl :0 Z Prt O
O Ho:µ1 < H2; Ha:µ1 > µ2
2. This is a CO rightO leftO two tailed test and the test used is a:
O Paired T-Test (dependent populations)
O2-Sample T-Test (independent populations)
O2-Sample Z-Test (independent populations)
The Degrees of Freedom (If needed, use the simple estimate discussed in the notes, not the messy formula)
are
0 6
MacBook Air
000
F2
F3
F5
F6
F7
F8
F9
4.
6.
8.
5
%#3
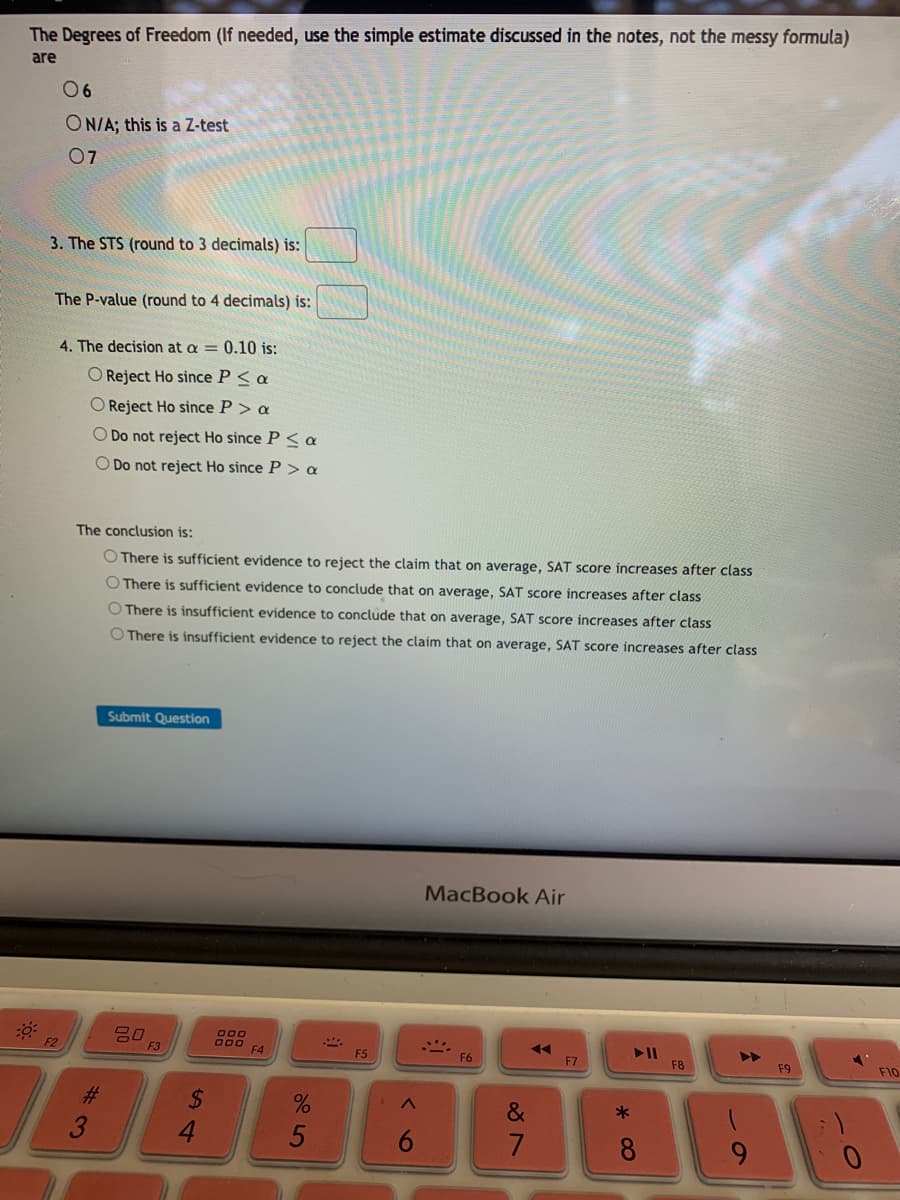
Transcribed Image Text:The Degrees of Freedom (If needed, use the simple estimate discussed in the notes, not the messy formula)
are
06
ON/A; this is a Z-test
07
3. The STS (round to 3 decimals) is:
The P-value (round to 4 decimals) is:
4. The decision at a = 0.10 is:
O Reject Ho since P< a
O Reject Ho since P> a
O Do not reject Ho since P< a
O Do not reject Ho since P > a
The conclusion is:
O There is sufficient evidence to reject the claim that on average, SAT score increases after class
O There is sufficient evidence to conclude that on average, SAT score increases after class
O There is insufficient evidence to conclude that on average, SAT score increases after clasS
O There is insufficient evidence to reject the claim that on average, SAT score increases after class
Submit Question
MacBook Air
F2
F3
000
F4
F5
F6
F7
F8
F9
F10
24
4.
&
6.
8
5
%#3
Expert Solution
This question has been solved!
Explore an expertly crafted, step-by-step solution for a thorough understanding of key concepts.

Step by step
Solved in 2 steps with 6 images

Knowledge Booster


Learn more about
Need a deep-dive on the concept behind this application? Look no further. Learn more about this topic, statistics and related others by exploring similar questions and additional content below.Recommended textbooks for you
Glencoe Algebra 1, Student Edition, 9780079039897…
Algebra
ISBN:
9780079039897
Author:
Carter
Publisher:
McGraw Hill
Glencoe Algebra 1, Student Edition, 9780079039897…
Algebra
ISBN:
9780079039897
Author:
Carter
Publisher:
McGraw Hill