Scenario 1 In 2007-09, the U.S. economy went through its worst economic downturn in 30 years. As a consequence of the sharp increase in the price of housing in the U.S. in the mid-2000s, a rapid increase in the demand for oil drove up oil prices. Additionally, the collapse of the housing market, which led to Lehman Brothers' bankruptcy, generated a financial crisis that reduced private spending. Refer to scenario 1 and question 68. In February 2009, the Congress approved the American Recovery and Reinvestment Act (ARRA) put forward by President Obama, consisting of US$ 78 billion in fiscal stimulus. Starting from the equilibrium at point B, how did the ARRA affect the economy? O The fiscal stimulus reduced government expenditure, shifting the AD curve to the right. The fiscal stimulus increased government expenditure, shifting the SRAS curve to the right. O The fiscal stimulus increased government expenditure, shifting the AD curve to the right. The fiscal stimulus reduced government expenditure, shifting the SRAS curve to the right.
Scenario 1 In 2007-09, the U.S. economy went through its worst economic downturn in 30 years. As a consequence of the sharp increase in the price of housing in the U.S. in the mid-2000s, a rapid increase in the demand for oil drove up oil prices. Additionally, the collapse of the housing market, which led to Lehman Brothers' bankruptcy, generated a financial crisis that reduced private spending. Refer to scenario 1 and question 68. In February 2009, the Congress approved the American Recovery and Reinvestment Act (ARRA) put forward by President Obama, consisting of US$ 78 billion in fiscal stimulus. Starting from the equilibrium at point B, how did the ARRA affect the economy? O The fiscal stimulus reduced government expenditure, shifting the AD curve to the right. The fiscal stimulus increased government expenditure, shifting the SRAS curve to the right. O The fiscal stimulus increased government expenditure, shifting the AD curve to the right. The fiscal stimulus reduced government expenditure, shifting the SRAS curve to the right.

Chapter10: Aggregate Supply
Section: Chapter Questions
Problem 2.3P

Related questions
Question
69
Transcribed Image Text:Scenario 1
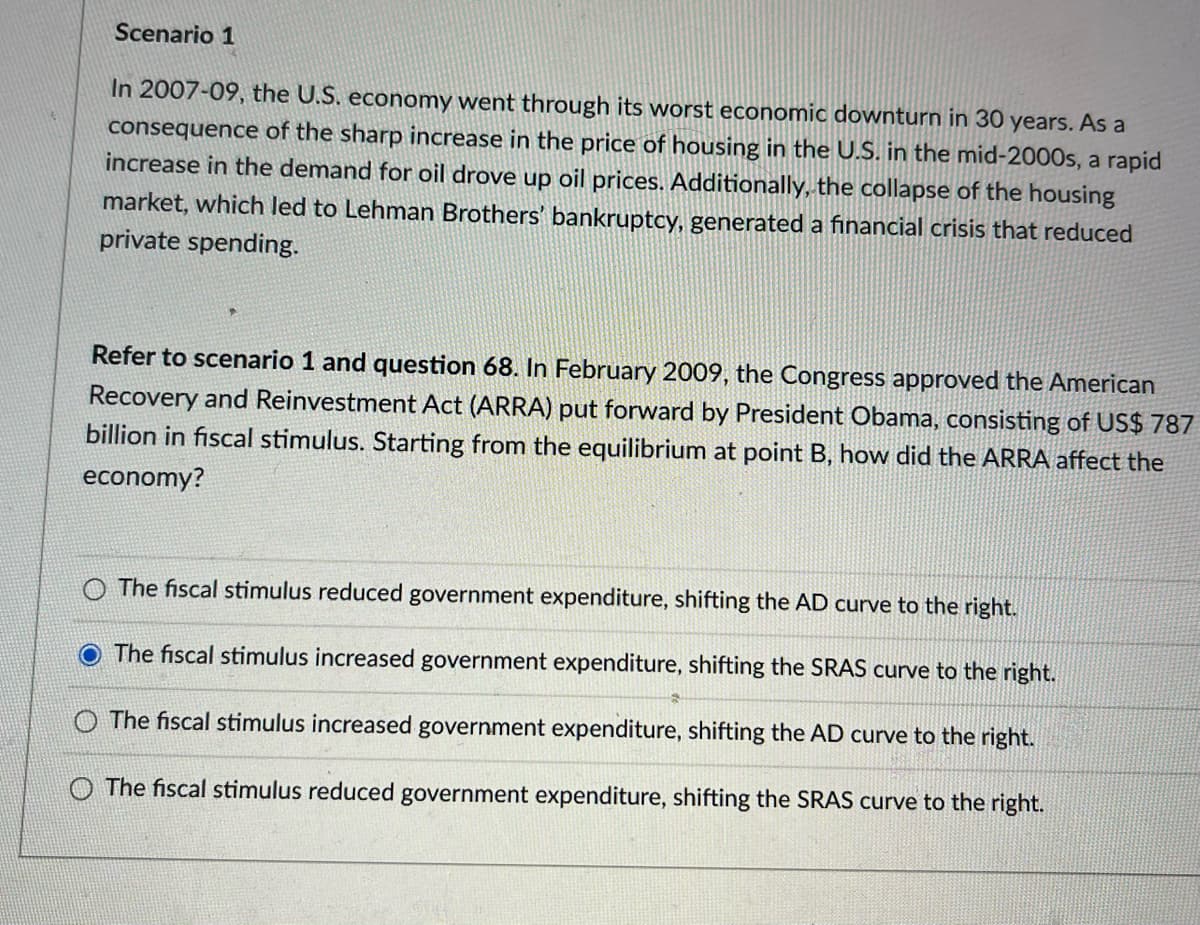
In 2007-09, the U.S. economy went through its worst economic downturn in 30 years. As a
consequence of the sharp increase in the price of housing in the U.S. in the mid-2000s, a rapid
increase in the demand for oil drove up oil prices. Additionally, the collapse of the housing
market, which led to Lehman Brothers' bankruptcy, generated a financial crisis that reduced
private spending.
Refer to scenario 1 and question 68. In February 2009, the Congress approved the American
Recovery and Reinvestment Act (ARRA) put forward by President Obama, consisting of US$ 787
billion in fiscal stimulus. Starting from the equilibrium at point B, how did the ARRA affect the
economy?
The fiscal stimulus reduced government expenditure, shifting the AD curve to the right.
O The fiscal stimulus increased government expenditure, shifting the SRAS curve to the right.
O The fiscal stimulus increased government expenditure, shifting the AD curve to the right.
The fiscal stimulus reduced government expenditure, shifting the SRAS curve to the right.
Expert Solution
This question has been solved!
Explore an expertly crafted, step-by-step solution for a thorough understanding of key concepts.

This is a popular solution!

Trending now
This is a popular solution!

Step by step
Solved in 2 steps

Knowledge Booster


Learn more about
Need a deep-dive on the concept behind this application? Look no further. Learn more about this topic, economics and related others by exploring similar questions and additional content below.Recommended textbooks for you

Exploring Economics
Economics
ISBN:
9781544336329
Author:
Robert L. Sexton
Publisher:
SAGE Publications, Inc

Macroeconomics: Private and Public Choice (MindTa…
Economics
ISBN:
9781305506756
Author:
James D. Gwartney, Richard L. Stroup, Russell S. Sobel, David A. Macpherson
Publisher:
Cengage Learning
Exploring Economics
Economics
ISBN:
9781544336329
Author:
Robert L. Sexton
Publisher:
SAGE Publications, Inc
Macroeconomics: Private and Public Choice (MindTa…
Economics
ISBN:
9781305506756
Author:
James D. Gwartney, Richard L. Stroup, Russell S. Sobel, David A. Macpherson
Publisher:
Cengage Learning

Economics: Private and Public Choice (MindTap Cou…
Economics
ISBN:
9781305506725
Author:
James D. Gwartney, Richard L. Stroup, Russell S. Sobel, David A. Macpherson
Publisher:
Cengage Learning