see picture for graphic and questions. Explanation The Cadet is a popular model of sport utility vehicle, known for its relatively high resale value. The bivariate data given below were taken from a sample of fifteen Cadets, each bought new two years ago, and each sold used within the past month. For each Cadet in the sample, we have listed both the mileage x (in thousands of miles) that the Cadet had on its odometer at the time it was sold used and the price y (in thousands of dollars) at which the Cadet was sold used. The least-squares regression line for these data has equation =y−41.67 - 0.49x. This line is shown in the scatter plot below.
see picture for graphic and questions. Explanation The Cadet is a popular model of sport utility vehicle, known for its relatively high resale value. The bivariate data given below were taken from a sample of fifteen Cadets, each bought new two years ago, and each sold used within the past month. For each Cadet in the sample, we have listed both the mileage x (in thousands of miles) that the Cadet had on its odometer at the time it was sold used and the price y (in thousands of dollars) at which the Cadet was sold used. The least-squares regression line for these data has equation =y−41.67 - 0.49x. This line is shown in the scatter plot below.

Chapter4: Linear Functions
Section: Chapter Questions
Problem 41RE: For the following exercises, consider the data in Table 5, which shows the percent of unemployed in...

Related questions
Question
see picture for graphic and questions.
Explanation
The Cadet is a popular model of sport utility vehicle, known for its relatively high resale value. The bivariate data given below were taken from a sample of fifteen Cadets, each bought new two years ago, and each sold used within the past month. For each Cadet in the sample, we have listed both the mileage x (in thousands of miles) that the Cadet had on its odometer at the time it was sold used and the price y (in thousands of dollars) at which the Cadet was sold used. The least-squares regression line for these data has equation =y−41.67 - 0.49x. This line is shown in the scatter plot below.
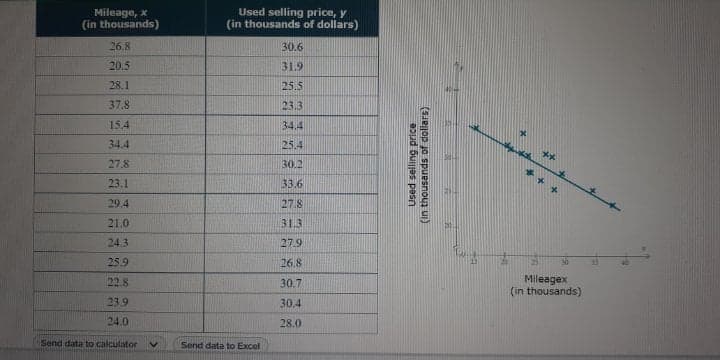
Transcribed Image Text:Mileage, x
(in thousands)
Used selling price, y
(in thousands of dollars)
26.8
30.6
20.5
31.9
28.1
25.5
37.8
23.3
15.4
34.4
34.4
25.4
27.8
30.2
23.1
33.6
29.4
27.8
21.0
31.3
24.3
27.9
25.9
26.8
Mileagex
(in thousands)
22.8
30.7
23.9
30.4
24.0
28.0
Send data to calculator
Send data to Excel
Used selling price
(in thousands of dollars)
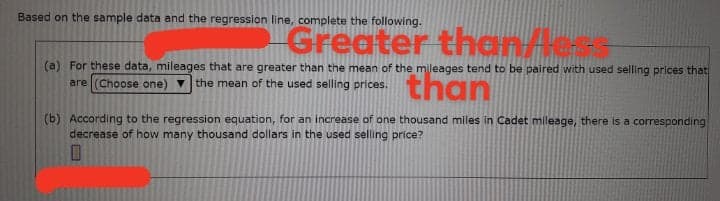
Transcribed Image Text:Based on the sample data and the regression line, complete the following.
Greater thentess
than
(a) For these data, mileages that are greater than the mean of the mileages tend to be paired with used selling prices that
are (Choose one) v the mean of the used selling prices.
(b) According to the regression equation, for an increase of one thousand miles in Cadet mileage, there is a corresponding
decrease of how many thousand dollars in the used selling price?
Expert Solution
This question has been solved!
Explore an expertly crafted, step-by-step solution for a thorough understanding of key concepts.

Step by step
Solved in 3 steps with 3 images

Recommended textbooks for you

Glencoe Algebra 1, Student Edition, 9780079039897…
Algebra
ISBN:
9780079039897
Author:
Carter
Publisher:
McGraw Hill

Algebra and Trigonometry (MindTap Course List)
Algebra
ISBN:
9781305071742
Author:
James Stewart, Lothar Redlin, Saleem Watson
Publisher:
Cengage Learning
Glencoe Algebra 1, Student Edition, 9780079039897…
Algebra
ISBN:
9780079039897
Author:
Carter
Publisher:
McGraw Hill
Algebra and Trigonometry (MindTap Course List)
Algebra
ISBN:
9781305071742
Author:
James Stewart, Lothar Redlin, Saleem Watson
Publisher:
Cengage Learning

Functions and Change: A Modeling Approach to Coll…
Algebra
ISBN:
9781337111348
Author:
Bruce Crauder, Benny Evans, Alan Noell
Publisher:
Cengage Learning