Look at the histogram below, which shows mileage, in miles per gallon (mpg), for a random selection of older passenger cars. (a) Is the shape of the histogram essentially bimodal? Yes, because the histogram has one peak. Yes, because the histogram has two peaks. No, because the histogram has one peak. No, because the histogram has two peaks. (b) Jose looked at the raw data and discovered that the 54 data values included both the city and highway mileages for 27 cars. He used the city mileages for the 27 cars to make the histogram below. (City.mpg is in photo at bottom) Using this information and the histograms shown above, construct a frequency table for the highway mileages of the same cars. Use class boundaries 16.5, 20.5, 24.5, 28.5, 32.5, 36.5, and 40.5. Class Boundaries Frequency - - - - - -


Inverse Normal Distribution
The method used for finding the corresponding z-critical value in a normal distribution using the known probability is said to be an inverse normal distribution. The inverse normal distribution is a continuous probability distribution with a family of two parameters.
Mean, Median, Mode
It is a descriptive summary of a data set. It can be defined by using some of the measures. The central tendencies do not provide information regarding individual data from the dataset. However, they give a summary of the data set. The central tendency or measure of central tendency is a central or typical value for a probability distribution.
Z-Scores
A z-score is a unit of measurement used in statistics to describe the position of a raw score in terms of its distance from the mean, measured with reference to standard deviation from the mean. Z-scores are useful in statistics because they allow comparison between two scores that belong to different normal distributions.
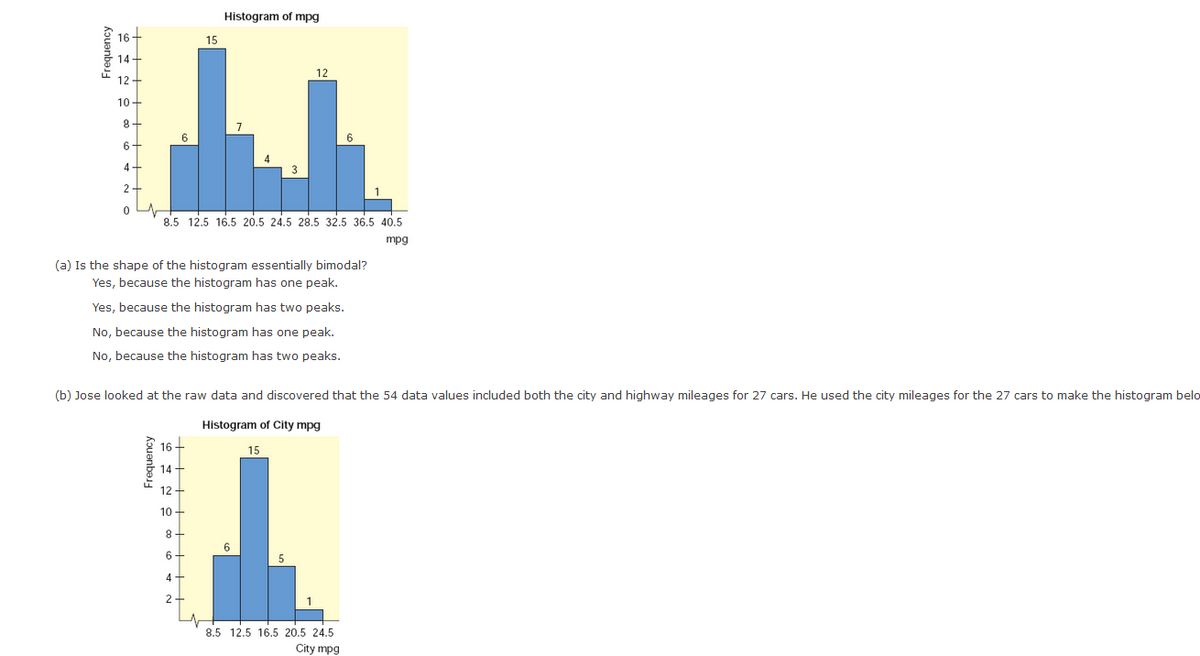
Look at the histogram below, which shows mileage, in miles per gallon (mpg), for a random selection of older passenger cars.
(a) Is the shape of the histogram essentially bimodal?
Yes, because the histogram has one peak.
Yes, because the histogram has two peaks.
No, because the histogram has one peak.
No, because the histogram has two peaks.
(b) Jose looked at the raw data and discovered that the 54 data values included both the city and highway mileages for 27 cars. He used the city mileages for the 27 cars to make the histogram below. (City.mpg is in photo at bottom)
Using this information and the histograms shown above, construct a frequency table for the highway mileages of the same cars. Use class boundaries 16.5, 20.5, 24.5, 28.5, 32.5, 36.5, and 40.5.
Class Boundaries Frequency
| - | ||
| - | ||
| - | ||
| - | ||
| - | ||
| - |


Trending now
This is a popular solution!

Step by step
Solved in 2 steps


