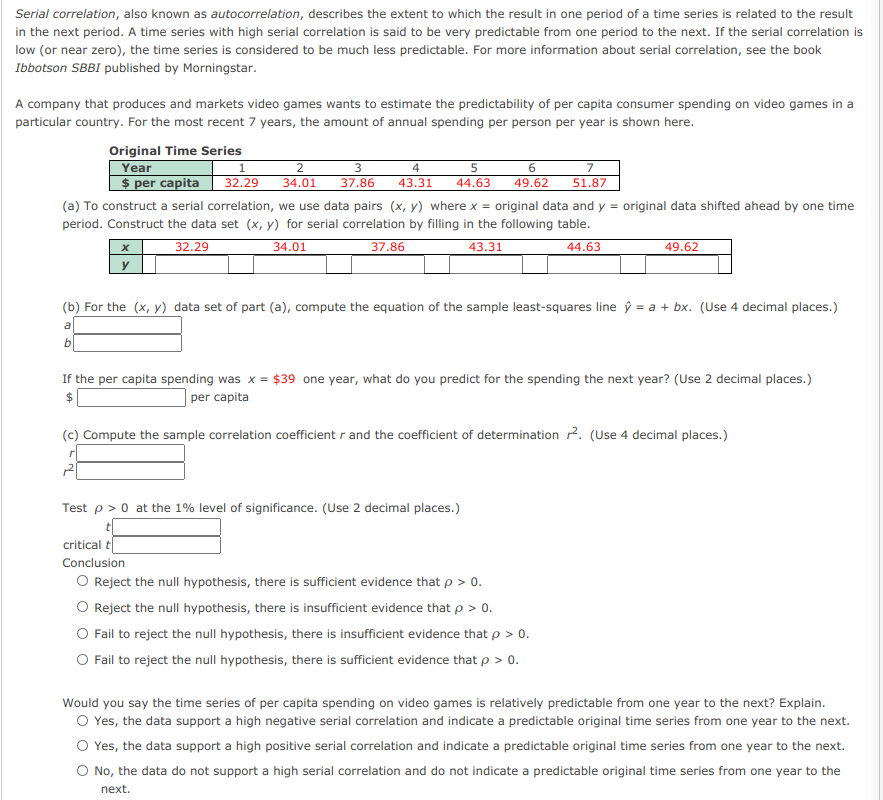
Serial correlation, also known as autocorrelation, describes the extent to which the result in one period of a time series is related to the result in the next period. A time series with high serial correlation is said to be very predictable from one period to the next. If the serial correlation is low (or near zero), the time series is considered to be much less predictable. For more information about serial correlation, see the book Ibbotson SBBI published by Morningstar. A company that produces and markets video games wants to estimate the predictability of per capita consumer spending on video games in a particular country. For the most recent 7 years, the amount of annual spending per person per year is shown here. Original Time Series Year $ per capita 2 3 37.86 1 5 4 32.29 34.01 43.31 44.63 49.62 51.87 (a) To construct a serial correlation, we use data pairs (x, y) where x = original data and y = original data shifted ahead by one time period. Construct the data set (x, Y) for serial correlation by filling in the following table. 32.29 34.01 37.86 43.31 44.63 49.62 y (b) For the (x, y) data set of part (a), compute the equation of the sample least-squares line ý = a + bx. (Use 4 decimal places.)


Correlation
Correlation defines a relationship between two independent variables. It tells the degree to which variables move in relation to each other. When two sets of data are related to each other, there is a correlation between them.
Linear Correlation
A correlation is used to determine the relationships between numerical and categorical variables. In other words, it is an indicator of how things are connected to one another. The correlation analysis is the study of how variables are related.
Regression Analysis
Regression analysis is a statistical method in which it estimates the relationship between a dependent variable and one or more independent variable. In simple terms dependent variable is called as outcome variable and independent variable is called as predictors. Regression analysis is one of the methods to find the trends in data. The independent variable used in Regression analysis is named Predictor variable. It offers data of an associated dependent variable regarding a particular outcome.


Trending now
This is a popular solution!

Step by step
Solved in 5 steps


