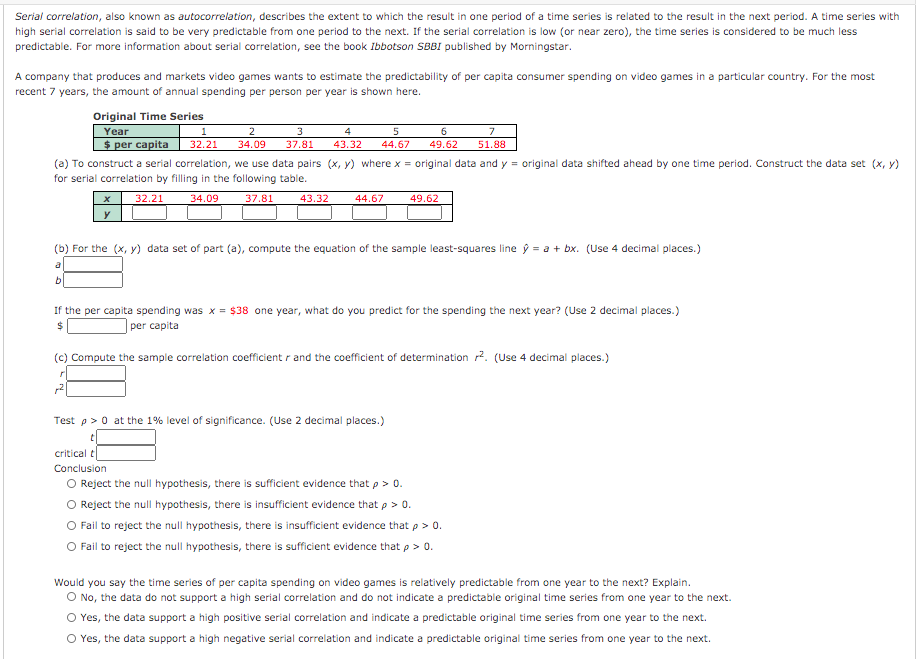
Serial correlation, also known as autocorrelation, describes the extent to which the result in one period of a time series is related to the result in the next period. A time series with high serial correlation is said to be very predictable from one period to the next. If the serial correlation is low (or near zero), the time series is considered to be much less predictable. For more information about serial correlation, see the book Ibbotson SBBI published by Morningstar. A company that produces and markets video games wants to estimate the predictability of per capita consumer spending on video games in a particular country. For the most recent 7 years, the amount of annual spending per person per year is shown here. Original Time Series Year $ per capita 2 4 5 32.21 34.09 37.81 43.32 44.67 49.62 51.88 (a) To construct a serial correlation, we use data pairs (x, y) where x = original data and y = original data shifted ahead by one time period. Construct the data set (x, y) for serial correlation by filling in the following table. 32.21 34.09 37.81 43.32 44.67 49.62 (b) For the (x, y) data set of part (a), compute the equation of the sample least-squares line ŷ = a + bx. (Use 4 decimal places.) If the per capita spending was x = $38 one year, what do you predict for the spending the next year? (Use 2 decimal places.) ] per capita 24 (c) Compute the sample correlation coefficient r and the coefficient of determination 2. (Use 4 decimal places.) Test p>0 at the 1% level of significance. (Use 2 decimal places.) critical t Conclusion O Reject the null hypothesis, there is sufficient evidence that p> 0. O Reject the null hypothesis, there is insufficient evidence that p > 0. O Fail to reject the null hypothesis, there is insufficient evidence that p > 0. O Fail to reject the null hypothesis, there is sufficient evidence that p> 0. Would you say the time series of per capita spending on video games is relatively predictable from one year to the next? Explain. O No, the data do not support a high serial correlation and do not indicate a predictable original time series from one year to the next. O Yes, the data support a high positive serial correlation and indicate a predictable original time series from one year to the next. O Yes, the data support a high negative serial correlation and indicate a predictable original time series from one year to the next.


Addition Rule of Probability
It simply refers to the likelihood of an event taking place whenever the occurrence of an event is uncertain. The probability of a single event can be calculated by dividing the number of successful trials of that event by the total number of trials.
Expected Value
When a large number of trials are performed for any random variable ‘X’, the predicted result is most likely the mean of all the outcomes for the random variable and it is known as expected value also known as expectation. The expected value, also known as the expectation, is denoted by: E(X).
Probability Distributions
Understanding probability is necessary to know the probability distributions. In statistics, probability is how the uncertainty of an event is measured. This event can be anything. The most common examples include tossing a coin, rolling a die, or choosing a card. Each of these events has multiple possibilities. Every such possibility is measured with the help of probability. To be more precise, the probability is used for calculating the occurrence of events that may or may not happen. Probability does not give sure results. Unless the probability of any event is 1, the different outcomes may or may not happen in real life, regardless of how less or how more their probability is.
Basic Probability
The simple definition of probability it is a chance of the occurrence of an event. It is defined in numerical form and the probability value is between 0 to 1. The probability value 0 indicates that there is no chance of that event occurring and the probability value 1 indicates that the event will occur. Sum of the probability value must be 1. The probability value is never a negative number. If it happens, then recheck the calculation.
Hi could you answer the blanks?

Step by step
Solved in 5 steps with 8 images


