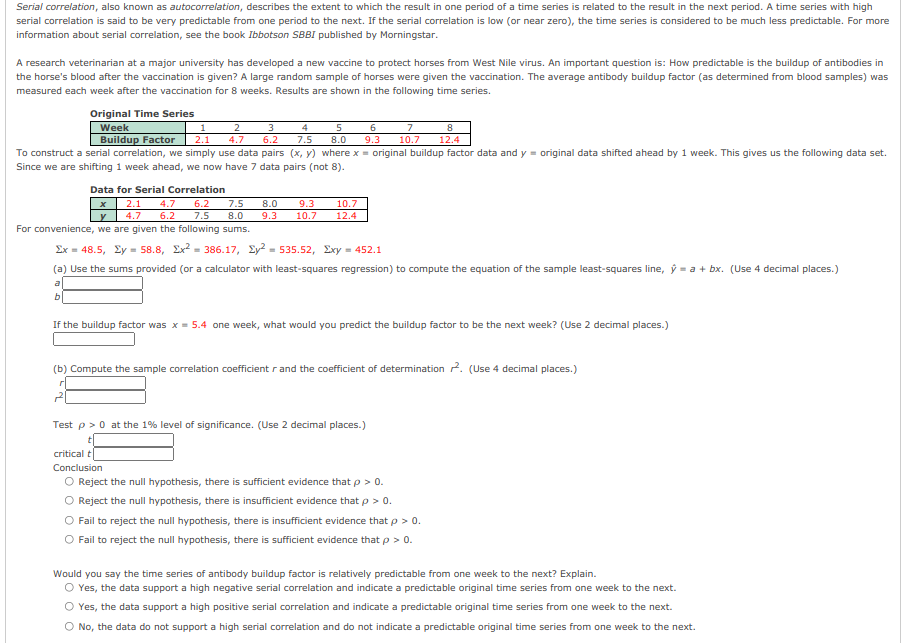
Serial correlation, also known as autocorrelation, describes the extent to which the result in one period of a time series is related to the result in the next period. A time series with high serial correlation is said to be very predictable from one period to the next. If the serial correlation is low (or near zero), the time series is considered to be much less predictable. For more nformation about serial correlation, see the book Ibbotson SBBI published by Morningstar. A research veterinarian at a major university has developed a new vaccine to protect horses from West Nile virus. An important question is: How predictable is the buildup of antibodies in the horse's blood after the vaccination is given? A large random sample of horses were given the vaccination. The average antibody buildup factor (as determined from blood samples) was measured each week after the vaccination for 8 weeks. Results are shown in the following time series. 8 12.4 To construct a serial correlation, we simply use data pairs (x, y) where x = original buildup factor data and y - original data shifted ahead by 1 week. This gives us the following data set. Original Time Series Week Buildup Factor 2 3 6.2 4 7.5 5 8.0 2.1 4.7 9.3 10.7 Since we are shifting 1 week ahead, we now have 7 data pairs (not 8). Data for Serial Correlation 6.2 8.0 For convenience, we are given the following sums. x2.1 y 4.7 6.2 7.5 7.5 8.0 9.3 9.3 10.7 10.7 12.4 4.7 Σx- 48.5 , Σy- 58.8 , Σ2-386. 17, Σy2535.52, Σxγ- 452.1 (a) Use the sums provided (or a calculator with least-squares regression) to compute the equation of the sample least-squares line, ý = a + bx. (Use 4 decimal places.) a If the buildup factor was x= 5.4 one week, what would you predict the buildup factor to be the next week? (Use 2 decimal places.) (b) Compute the sample correlation coefficient r and the coefficient of determination 2. (Use 4 decimal places.) Test p > 0 at the 1% level of significance. (Use 2 decimal places.) critical t Conclusion O Reject the null hypothesis, there is sufficient evidence that p > 0. O Reject the null hypothesis, there is insufficient evidence that p > 0. O Fail to reject the null hypothesis, there is insufficient evidence that p > 0. O Fail to reject the null hypothesis, there is sufficient evidence that p > 0. Would you say the time series of antibody buildup factor is relatively predictable from one week to the next? Explain. O Yes, the data support a high negative serial correlation and indicate a predictable original time series from one week to the next. O Yes, the data support a high positive serial correlation and indicate a predictable original time series from one week to the next. O No, the data do not support a high serial correlation and do not indicate a predictable original time series from one week to the next.


Correlation
Correlation defines a relationship between two independent variables. It tells the degree to which variables move in relation to each other. When two sets of data are related to each other, there is a correlation between them.
Linear Correlation
A correlation is used to determine the relationships between numerical and categorical variables. In other words, it is an indicator of how things are connected to one another. The correlation analysis is the study of how variables are related.
Regression Analysis
Regression analysis is a statistical method in which it estimates the relationship between a dependent variable and one or more independent variable. In simple terms dependent variable is called as outcome variable and independent variable is called as predictors. Regression analysis is one of the methods to find the trends in data. The independent variable used in Regression analysis is named Predictor variable. It offers data of an associated dependent variable regarding a particular outcome.


Trending now
This is a popular solution!

Step by step
Solved in 3 steps


