Specifically, Mr. Schaefer wants you to do the following: PART 1. Prepare a cost-volume-profit (CVP) analysis of the proposal's financial implications. 1. Specifically, prepare an analysis that includes the projected revenue, variable costs, and fixed costs for enrollment levels of 20, 25, 30 and 37 students using the monthly projections in Attachment A of the case. 2. Then, compute the weighted average contribution margin (CM) per student (computed as the total CM divided by the number of students enrolled) and 3. The number of students that need to enroll at each of the four levels of enrollment for the center to break even. For this analysis, I have provided an Excel template in which I have already sorted variable and fixed costs: I have included the raw data. Note: Your enrollment information has already been weighted so you will not need to calculate weights for your weighted average CM.


Specifically, Mr. Schaefer wants you to do the following:
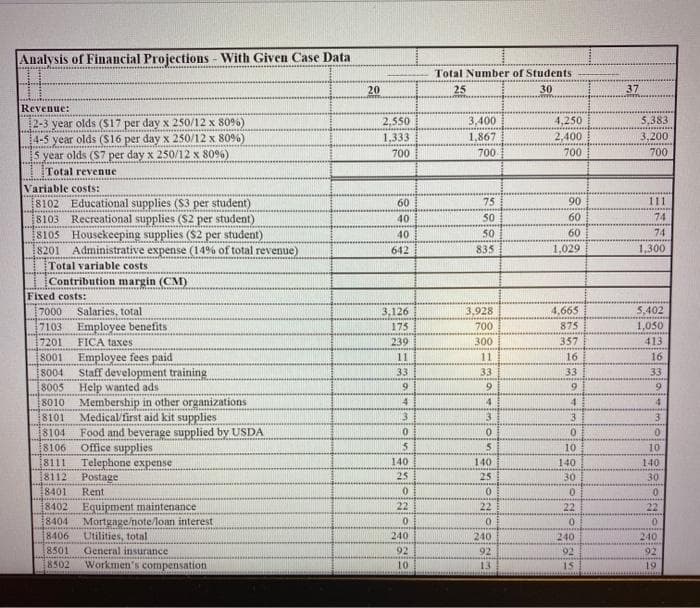
PART 1. Prepare a cost-volume-profit (CVP) analysis of the proposal's financial implications.
1. Specifically, prepare an analysis that includes the projected revenue, variable costs, and fixed costs for enrollment levels of 20, 25, 30 and 37 students using the monthly projections in Attachment A of the case.
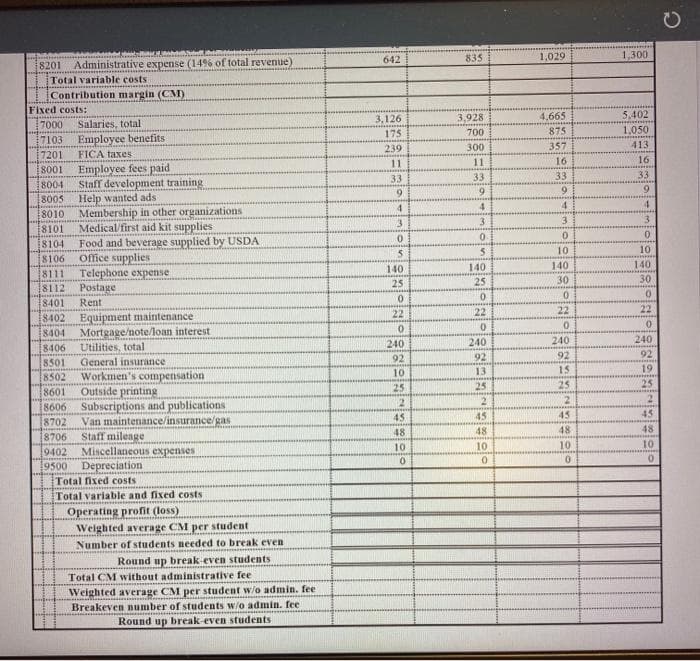
2. Then, compute the weighted average contribution margin (CM) per student (computed as the total CM divided by the number of students enrolled) and
3. The number of students that need to enroll at each of the four levels of enrollment for the center to break even. For this analysis, I have provided an Excel template in which I have already sorted variable and fixed costs: I have included the raw data. Note: Your enrollment information has already been weighted so you will not need to calculate weights for your weighted average CM.


Trending now
This is a popular solution!

Step by step
Solved in 2 steps with 5 images


