Hb Great Lakes 0.8 1. ;) The diagram on the right compares the O2 binding prop- erties or normal adult hemoglobin (HbA) to those of one dubbed Hb Great-Lakes characterized by the mutation Leu (ẞ68)His. In the dia- gram Y = fraction of heme groups with bound O2, and pO2, the par- tial pressure of O2 above the solution, is measured in units of torr or mmHg. Draw the corresponding Hill plot, being careful to reproduce graph- ically the dissociation equilibrium constant for O2 binding (K02) for Y each hemoglobin and to show the difference in the extent of allo- stery or cooperativity of subunit interaction in each type of hemo- globin. You need draw only the central, linear portion of the Hill plot. State what is the likely magnitude of the Hill constant (nн) for HbA from your reading and state what is the likely range of the magni- tude of the Hill coefficient for Hb Great Lakes. 1.0 0.6 0.4 0.2 Hb A T 0 10 20 30 40 50 60 pO2 (torr)
Hb Great Lakes 0.8 1. ;) The diagram on the right compares the O2 binding prop- erties or normal adult hemoglobin (HbA) to those of one dubbed Hb Great-Lakes characterized by the mutation Leu (ẞ68)His. In the dia- gram Y = fraction of heme groups with bound O2, and pO2, the par- tial pressure of O2 above the solution, is measured in units of torr or mmHg. Draw the corresponding Hill plot, being careful to reproduce graph- ically the dissociation equilibrium constant for O2 binding (K02) for Y each hemoglobin and to show the difference in the extent of allo- stery or cooperativity of subunit interaction in each type of hemo- globin. You need draw only the central, linear portion of the Hill plot. State what is the likely magnitude of the Hill constant (nн) for HbA from your reading and state what is the likely range of the magni- tude of the Hill coefficient for Hb Great Lakes. 1.0 0.6 0.4 0.2 Hb A T 0 10 20 30 40 50 60 pO2 (torr)

Human Physiology: From Cells to Systems (MindTap Course List)
9th Edition
ISBN:9781285866932
Author:Lauralee Sherwood
Publisher:Lauralee Sherwood
Chapter11: The Blood
Section: Chapter Questions
Problem 1SQE

Related questions
Question
Transcribed Image Text:1.1
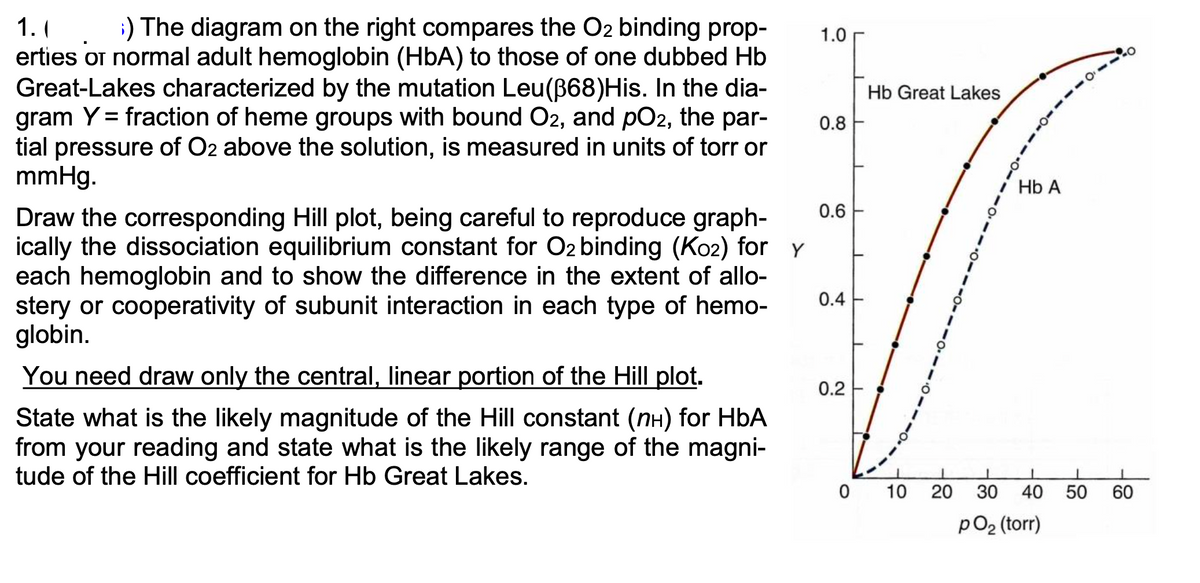
;) The diagram on the right compares the O2 binding prop-
1.0
erties or normal adult hemoglobin (HbA) to those of one dubbed Hb
Great-Lakes characterized by the mutation Leu(B68)His. In the dia-
gram Y = fraction of heme groups with bound O2, and pO2, the par-
tial pressure of O2 above the solution, is measured in units of torr or
mmHg.
Hb Great Lakes
%3D
0.8
Hb A
0.6
Draw the corresponding Hill plot, being careful to reproduce graph-
ically the dissociation equilibrium constant for O2 binding (Ko2) for Y
each hemoglobin and to show the difference in the extent of allo-
stery or cooperativity of subunit interaction in each type of hemo-
globin.
0.4
You need draw only the central, linear portion of the Hill plot.
0.2 F
State what is the likely magnitude of the Hill constant (nH) for HbA
from your reading and state what is the likely range of the magni-
tude of the Hill coefficient for Hb Great Lakes.
0 10 20
30 40
50
60
pO2 (torr)
Expert Solution
This question has been solved!
Explore an expertly crafted, step-by-step solution for a thorough understanding of key concepts.

This is a popular solution!

Trending now
This is a popular solution!

Step by step
Solved in 4 steps with 20 images

Recommended textbooks for you
Human Physiology: From Cells to Systems (MindTap …
Biology
ISBN:
9781285866932
Author:
Lauralee Sherwood
Publisher:
Cengage Learning
Human Physiology: From Cells to Systems (MindTap …
Biology
ISBN:
9781285866932
Author:
Lauralee Sherwood
Publisher:
Cengage Learning