Table 1. Weight (g) of harvested fruits of tomato Block II III Total Mean T1 2.33 2.17 3.95 T2 2.65 2.60 T3 2.99 2.09 2.31 T4 2.98 1.92 2.06 T5 2.49 3.47 4.03 Total 2.70 2.46 2.99 Mean Grand Mean 4. How many blocks/replications) are involved in this table? 5. This table is an example of treatment with equal or unequal? 6. How many treatments are involved in this table?
Table 1. Weight (g) of harvested fruits of tomato Block II III Total Mean T1 2.33 2.17 3.95 T2 2.65 2.60 T3 2.99 2.09 2.31 T4 2.98 1.92 2.06 T5 2.49 3.47 4.03 Total 2.70 2.46 2.99 Mean Grand Mean 4. How many blocks/replications) are involved in this table? 5. This table is an example of treatment with equal or unequal? 6. How many treatments are involved in this table?

Glencoe Algebra 1, Student Edition, 9780079039897, 0079039898, 2018
18th Edition
ISBN:9780079039897
Author:Carter
Publisher:Carter
Chapter10: Statistics
Section10.3: Measures Of Spread
Problem 1GP

Related questions
Question
Pls Answer 4, 5, 6
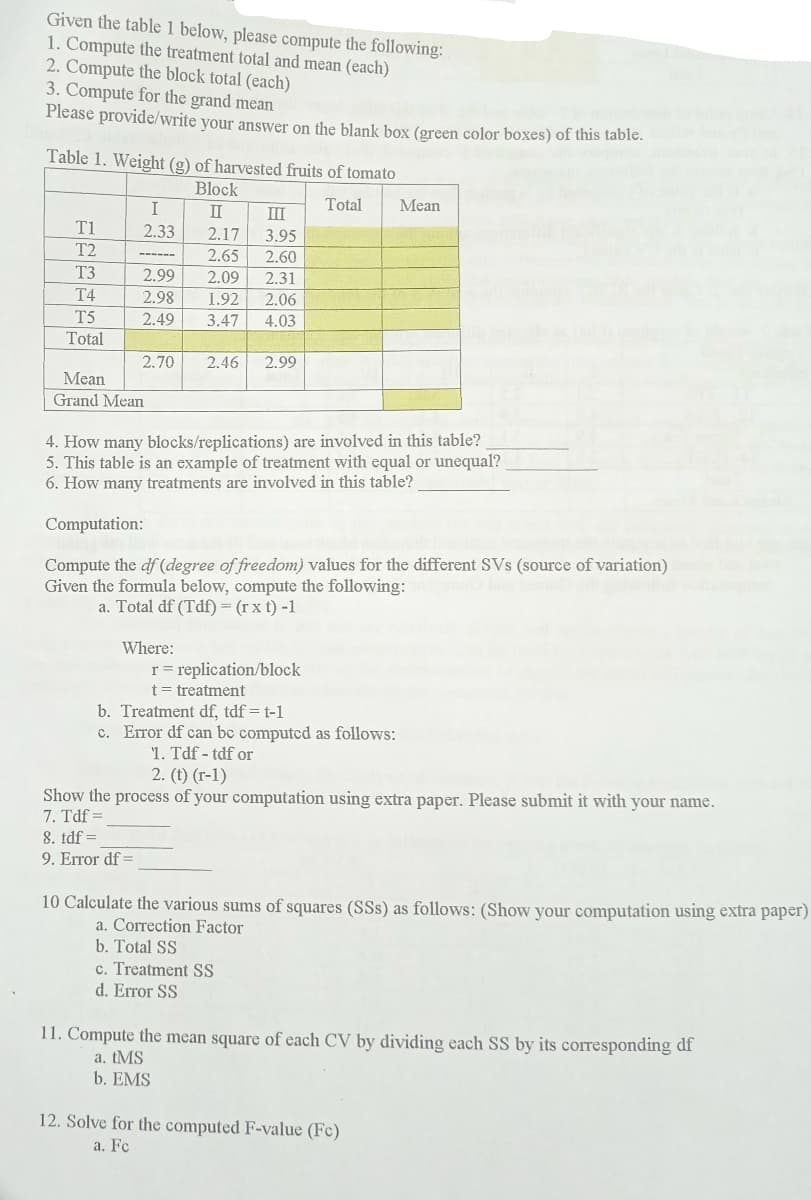
Transcribed Image Text:Given the table 1 below, please compute the following:
1. Compute the treatment total and mean (each)
2. Compute the block total (each)
3. Compute for the grand mean
Please provide/write your answer on the blank box (green color boxes) of this table.
Table 1. Weight (g) of harvested fruits of tomato
Block
I
II
III
Total
Mean
T1
2.33
2.17
3.95
T2
2.65
2.60
-----
T3
2.99
2.09
2.31
T4
2.98
1.92
2.06
T5
2.49
3.47
4.03
Total
2.70
2.46
2.99
Mean
Grand Mean
4. How many blocks/replications) are involved in this table?
This table is an example of treatment with equal or unequal?
6. How many treatments are involved in this table?
Computation:
Compute the df (degree of freedom) values for the different SVs (source of variation)
Given the formula below, compute the following:
a. Total df (Tdf) = (r x t) -1
Where:
r = replication/block
t = treatment
b. Treatment df, tdf = t-1
c. Error df can bc computed as follows:
1. Tdf - tdf or
2. (t) (r-1)
Show the process of your computation using extra paper. Please submit it with your name.
7. Tdf =
8. tdf =
9. Error df =
10 Calculate the various sums of squares (SSs) as follows: (Show your computation using extra paper)
a. Correction Factor
b. Total SS
c. Treatment SS
d. Error SS
11. Compute the mean square of each CV by dividing each SS by its corresponding df
a. tMS
b. EMS
12. Solve for the computed F-value (Fc)
а. Fc
Expert Solution
This question has been solved!
Explore an expertly crafted, step-by-step solution for a thorough understanding of key concepts.

Step by step
Solved in 2 steps

Recommended textbooks for you
Glencoe Algebra 1, Student Edition, 9780079039897…
Algebra
ISBN:
9780079039897
Author:
Carter
Publisher:
McGraw Hill
Glencoe Algebra 1, Student Edition, 9780079039897…
Algebra
ISBN:
9780079039897
Author:
Carter
Publisher:
McGraw Hill