
MATLAB: An Introduction with Applications
6th Edition
ISBN: 9781119256830
Author: Amos Gilat
Publisher: John Wiley & Sons Inc
expand_more
expand_more
format_list_bulleted
Related questions
Question
1) If we choose the significance level α=0.01, is the variable Smoker a significant factor in explaining the risk of a stroke? Explain.
2) What are the lower and upper bounds of the 99% confidence interval for the regression coefficient of the variable Smoker?
3) Can you tell from the 99% confidence interval whether the variable Smoker a significant factor in explaining the risk of a stroke?
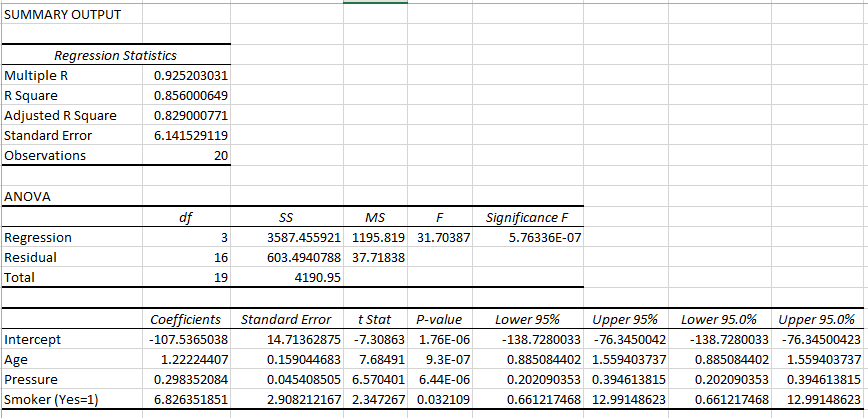

Transcribed Image Text:SUMMARY OUTPUT
Regression Statistics
Multiple R
R Square
Adjusted R Square
Standard Error
Observations
ANOVA
Regression
Residual
Total
Intercept
Age
Pressure
Smoker (Yes=1)
0.925203031
0.856000649
0.829000771
6.141529119
df
20
3
16
19
SS
MS
F
3587.455921 1195.819 31.70387
603.4940788 37.71838
4190.95
Coefficients Standard Error t Stat P-value
-107.5365038
1.22224407
0.298352084
6.826351851
14.71362875 -7.30863 1.76E-06
0.159044683 7.68491 9.3E-07
0.045408505 6.570401 6.44E-06
2.908212167 2.347267 0.032109
Significance F
5.76336E-07
Lower 95%
Upper 95%
Lower 95.0%
Upper 95.0%
-138.7280033 -76.3450042 -138.7280033 -76.34500423
0.885084402 1.559403737 0.885084402 1.559403737
0.202090353 0.394613815 0.202090353 0.394613815
0.661217468 12.99148623 0.661217468 12.99148623
Expert Solution
This question has been solved!
Explore an expertly crafted, step-by-step solution for a thorough understanding of key concepts.

Step by stepSolved in 2 steps

Knowledge Booster

Similar questions
- Predicting Percent Body FatThis problem uses the dataset BodyFat, which gives the percent of weight made up of body fat for 100 men as well as other variables such as Age, Weight (in pounds), Height (in inches), and circumference (in cm) measurements for the Neck, Chest, Abdomen, Ankle, Biceps, and Wrist.1Using Neck Circumference to Predict Body FatThe regression line for predicting body fat percent using neck circumference is BodyFat^=-47.9+1.75(Neck). Click here for the dataset associated with this question. (a) What body fat percent does the line predict for a person with a neck circumference of 35 cm?Round your answer to two decimal places.BodyFat^= %What body fat percent does the line predict for a person with a neck circumference of 40 cm?Round your answer to one decimal place.BodyFat^= % (b) One of the men in the study had a neck circumference of 38.7 cm and a body fat percent of 11.3. Find the residual for this man.Round your answer to three decimal places.residual= %…arrow_forwardData on 17 randomly selected athletes was obtained concerning their cardiovascular fitness (measured by time to exhaustion running on a treadmill) and performance in a 20-km ski race. Both variables were measured in minutes and a regression analysis was performed. ski = 86 2.4 treadmill Coefficients Estimate (Intercept) Treadmill 86 -2.4 Std. Error What is the test statistic? -2.791 0.26 0.86 Is there sufficient evidence to conclude that there is a linear relationship between cardiovascular fitness and ski race performance? Round your answers to three decimal places. Using your answer from the previous question, find the p-value. Part 2 of 3arrow_forwardWhat mean physical health score would you expect in a group of 28-year-old women with a graduate degree?arrow_forward
- When can you use the Chebyshev criterion, and when you cannot? If the Cebyshev criterion cannot be used how do you determine that your model is a good fit to the data set?arrow_forwardConduct a hypothesis for whether consumption and income are linearly related using ? =0.01. The standard error of the slope is 0.144. Slope = 0.75, Intercept = 0, sample:Income 9, 11, 5, 8, 2, 9, 12Consumption 7, 7, 2, 7, 2, 8, 9 Step 1: State the null and alternative hypotheses.Step 2: Choose the significance level.Step 3: Calculate the test statistic.Step 4: Find the critical value(s).Step 5: Compare the test statistic to the critical value(s).Step 6: State the conclusion.arrow_forwardHow would you interpret this data?arrow_forward
- Data on 12 randomly selected athletes was obtained concerning their cardiovascular fitness (measured by time to exhaustion running on a treadmill) and performance in a 20-km ski race. Both variables were measured in minutes and a regression analysis was performed. ski 85 2.5. treadmill = Coefficients Estimate (Intercept) Treadmill 85 - 2.5 Std. Error What is the test statistic? -2.5 0.45 1 Is there sufficient evidence to conclude that there is a linear relationship between cardiovascular fitness and ski race performance? Round your answers to three decimal places. Using your answer from the previous question, find the p-value. Part 2 oarrow_forwardParametric tests (such as t-tests or ANOVAs) differ from nonparametric tests (such as chi-square) primarily in terms of the assumptions they require and the data they use. Explain these differences.arrow_forwardsolve correctly. I will rate accordingly. please explain your choce.arrow_forward
- pare percentage differences between 2 or more categories of an independent variable), the following statistical test should be used: a. Simple linear regression b. Pearson correlation coefficient c. T test d. Chi-square testarrow_forwardThe prediction equation for the data given below is y_hat = -3.98 + 0.56x. What is the residual value when x = 10? 10 2 11 2 15 4 17 0.38 1.62 None Existsarrow_forwardul Sprint 11:42 AM 86% Done Attachment 8 Use the given data to find the equation of the regression line. Round the final values to three significant digits, if necessary. 1 3 5 7 9 9) y| 143 116 100 98 90 9) A) y = -150.7 + 6.8x B) y = -140.4 + 6.2x C) y = 140.4 – 6.2x D) y = 150.7 – 6.8xarrow_forward
arrow_back_ios
SEE MORE QUESTIONS
arrow_forward_ios
Recommended textbooks for you
- MATLAB: An Introduction with ApplicationsStatisticsISBN:9781119256830Author:Amos GilatPublisher:John Wiley & Sons Inc
 Probability and Statistics for Engineering and th...StatisticsISBN:9781305251809Author:Jay L. DevorePublisher:Cengage Learning
 Statistics for The Behavioral Sciences (MindTap C...StatisticsISBN:9781305504912Author:Frederick J Gravetter, Larry B. WallnauPublisher:Cengage Learning
  Elementary Statistics: Picturing the World (7th E...StatisticsISBN:9780134683416Author:Ron Larson, Betsy FarberPublisher:PEARSON
 The Basic Practice of StatisticsStatisticsISBN:9781319042578Author:David S. Moore, William I. Notz, Michael A. FlignerPublisher:W. H. Freeman
 Introduction to the Practice of StatisticsStatisticsISBN:9781319013387Author:David S. Moore, George P. McCabe, Bruce A. CraigPublisher:W. H. Freeman
MATLAB: An Introduction with Applications
Statistics
ISBN:9781119256830
Author:Amos Gilat
Publisher:John Wiley & Sons Inc
Probability and Statistics for Engineering and th...
Statistics
ISBN:9781305251809
Author:Jay L. Devore
Publisher:Cengage Learning
Statistics for The Behavioral Sciences (MindTap C...
Statistics
ISBN:9781305504912
Author:Frederick J Gravetter, Larry B. Wallnau
Publisher:Cengage Learning
Elementary Statistics: Picturing the World (7th E...
Statistics
ISBN:9780134683416
Author:Ron Larson, Betsy Farber
Publisher:PEARSON
The Basic Practice of Statistics
Statistics
ISBN:9781319042578
Author:David S. Moore, William I. Notz, Michael A. Fligner
Publisher:W. H. Freeman
Introduction to the Practice of Statistics
Statistics
ISBN:9781319013387
Author:David S. Moore, George P. McCabe, Bruce A. Craig
Publisher:W. H. Freeman