SUPPLY CHAIN SEGMENTATION ABC ANALYSIS PART ID PRICE (USD) ANNUAL DEMAND PO01 2.25 260 PO02 2.85 43 P003 PO04 1.50 21 0.70 388 PO05 4.45 612 PO06 6.10 220 PO07 3.10 110 PO08 PO09 P010 1.32 786 12.80 14 334 24 24.99 7.75 P011 P012 P013 P014 0.68 77 0.25 56 3.89 89 PO15 7.70 675 D016
Q: Use the file on Blackboard called "Excel Databases.xlsx". Locate the Consumer Food tab. How many…
A: In the given databases, we have to calculate the number of 1's for a household of the metro area and…
Q: Milka makes boxes of chocolates for which the demand is uncertain. " Quarterly demand (in boxes of…
A: Given information: Quarter Year 1 Year 2 Year 3 Year 4 1 3000 3300 3502 3700 2 1700 2100…
Q: Harvard University has recently revolutionized its financial aid policies, aimed at easing the…
A: The data given below shows the cost of attendance to school by family income with their respective…
Q: Median Family income has grown substantially in the recent years. Years Income…
A:
Q: Industry Sectors Service Trade and Transporation Total sector United States Total Employment 68%…
A: Percentage change for Services: Percentage for 2010 is 68 and for 2020 it is 69% Hence Percentage…
Q: Annual Food Spending ($) Annual Household Income ($) Non mortgage household debt ($)…
A: Consumer food data is given, where y is considered as a predictor variable annual food spending and…
Q: A manufacturer of a popular digital camera wholesales the camera to retail outlets throughout the…
A: Hi. You have asked multiple questions. We will only solve the first three. Post the remaining…
Q: A local bank wants to study waiting times of customers. A subgroup of four customers is selected,…
A: Let Xij be the measurement on the jth sample. (j=1,2,....,n and i=1,2,....,k) To construct a control…
Q: Palisades Eco-Park is a small ecological reserve that admits a relatively small number of visitors…
A: Introduction: It is of interest to estimate the labor cost using the number of visitors. Thus, the…
Q: Milka makes boxes of chocolates for which the demand is uncertain. " Quarterly demand (in boxes of…
A: Given information: Quarter Year 1 Year 2 Year 3 1 3000 3300 3502 2 1700 2100 2448 3 900…
Q: Use the Consumer Food database from "Excel Databases.xls" on Blackboard. Use Excel to develop a…
A: In the multiple regression equation, one dependent variable is related with multiple independent…
Q: Use Excel to develop a regression model for the Consumer Food Database (using the "Excel…
A: Step-by-step procedure to find the regression line using Excel: In Excel sheet, enter Annual house…
Q: Use the Consumer Food database from "Excel Databases.xls" on Blackboard. Use Excel to develop a…
A: A random variable, that is of the interest of study, is taken as dependent variable. A dependent…
Q: policy. The following table reports the number of cars and light duty trucks sold by the eight…
A: a) Manufacturer Through February 2010 (x) Through February 2009 (y) x-y General Motors Corp.…
Q: Sleep Late, a large hotel chain, has been using activity-based costing to determine the cost of a…
A:
Q: Calculate the activity-based unit cost of the smartphone case $______ Wieters Industries…
A: if you find my answer helpful please put thumbs up. thank you. the required solution is given below…
Q: Develop a regression model
A: Regression: It is a statistical tool to show the relationship between dependent variable Y and…
Q: A gasoline mini-mart orders 26 copies of a monthly magazine. Depending on the cover story, demand…
A:
Q: Historical demand for the product is: Month Demand January 12 February 11 March 15 April 12 May 16…
A: The demand for July month can be forecasted by using weighted average method with 60% weight to the…
Q: Even though independent gasoline stations have been having a difficult time, Susan Solomon has been…
A: a b Using the Maximax criterion, the decision is to open a Very Large Station. c Using the Maximin…
Q: Use the Consumer Food database from "Excel Databases.xls" on Blackboard. Use Excel to develop a…
A: Given: Annual Household Income = $60,000 Non mortgage household debt = $10,000
Q: CASE STUDY 2 The continuous surge in oil prices in 2007 and 2008 saw a sharp rise in the cost of…
A:
Q: SALES($1000s) MONTH SALES($1,000s) MONTH 11 January 14 August 14 February 17 September…
A: “Since you have posted a question with multiple sub-parts, we will solve first three sub-parts for…
Q: Amazon.com has become one of the most successful online merchants. Two measures of its success are…
A:
Q: Separating Fixed and Variable Costs, Service Setting A company has identified the following data…
A: 1) Use the excel to form a scatter graph based on the given data:
Q: (ii) Ten months data are available that is: Month Jan. Orders 120 Compute demand forecasting for…
A: To obtain the three-month weighted moving average, obtain the average of first three…
Q: puestion # 9: The manager of a car plant wishes to investigate how the plant's electricity usage…
A: Given
Q: Use Excel to develop a regression model for the Consumer Food Database (using the "Excel…
A: Given: n=200
Q: Dixie Showtime Movie Theaters, Inc., owns and operates a chain of cinemas in several markets in the…
A: Given data indicates weekly gross revenue as a function of advertising expenditures for a sample of…
Q: Annual Food Spending ($) Annual Household Income ($) Non mortgage household debt ($)…
A: suppose a household in the metro area has an annual income of $60,000 Here we have to find spending…
Q: Consider a linear demand model to explain the quantity demanded for a product: Q= a+ B, Price+ B,…
A: Linear regressions are of two types, simple linear regression and multiple linear regression. In…
Q: Palisades Eco-Park is a small ecological reserve that admits a relatively small number of visitors…
A: Given :
Q: World supply of recycled silver, Q, in millions of ounces and the price of silver, P, in dollars per…
A: Scatter diagram is the simplest method of studying the nature of correlation between two variables.
Q: Dixie Showtime Movie Theaters, Inc., owns and operates a chain of cinemas in several markets in the…
A: Given Information: The owners would like to estimate weekly gross revenue as a function of…
Q: recent week follow. Market Weekly Gross Revenue ($100s) Television Advertising ($100s)…
A:
Q: Dixie Showtime Movie Theaters, Inc., owns and operates a chain of cinemas in several markets in the…
A: Given :
Q: Period People (Y) Ocupation percentage (X) 2009 1T 46,977,904 59.7 2009 2T 47,453,163 59.3…
A: The data is entered in a spreadsheet. The standard deviation (S) of X and Y respectively is…
Q: From the data given below, aggregative expenditure ideal method: Commodity Current Year Base Year…
A: The price of commodities in the base year as well as current year by its corresponding the weight in…
Q: The attached cost-output data were obtained as part of a study of the economies of scale in…
A: Based on the given data of cost function as a student in average daily attendance, we can see which…
Q: Accounting The following information is available regarding the total repair costs of Comfort…
A: Given: Units produced Repair cost 1500 14875 1750 15500 1000 12,250…
Q: Walmart Revenue The annual revenue of Walmart is given in the table below (source e). |Walmart…
A: Here x represents number of years since 2000 y represents annual revenue in billions of dollars.
Q: Real Estate One conducted a recent survey of house prices for properties located on the shores of…
A: Note: Hi there! Thank you for posting the question. As your question has more than 3 parts, we have…
Q: Quantitative Research Statistical Data Analysis using Software ( SPSS / PLS - SEM ) 1 ) Study the…
A: Given:Output is given based on the two different data sets.Find:Interpretations.
Q: QUESTION 1 Develop a regression model for the Consumer Food Database (using the "Excel…
A: Given : To predict Annual food spending by annual household income. In this situation, annual food…
Q: Use the file on Blackboard called "Excel Databases.xlsx". Locate the Consumer Food tab. Test to…
A: Problem Question : Use the file on Blackboard called "Excel.Databses.xlsx". Locate the consumer food…
Q: Using exponential smoothing, calculate the forecasts for months 2, 3, 4, 5, and 6. Thesmoothing…
A: Solution: Given information: α=0.2 Smoothing constant The forecast for month one is 245
Q: Use the file on Blackboard called "Excel Databases.xlsx". Locate the Consumer Food tab. Test to…
A: Given information: Given data represents the annual food spending for the individuals living in…
Create logical groupings (A,B,C) using percentage annual value in the figure below. Explain your answer(s).
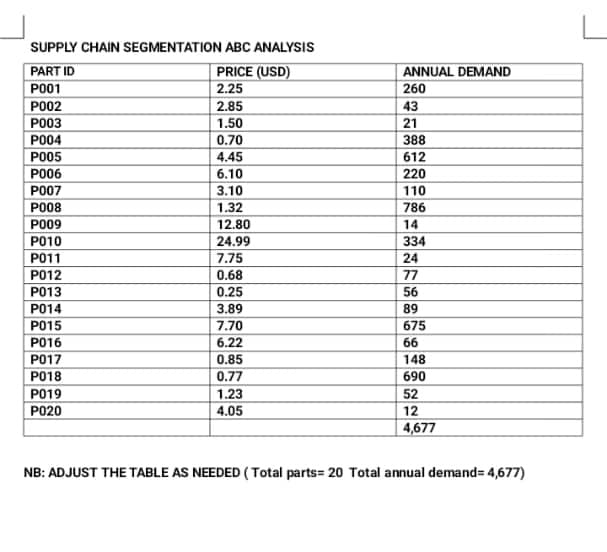
Step by step
Solved in 2 steps
- Palisades Eco-Park is a small ecological reserve that admits a relatively small number of visitors on any day, but provides both educational and entertaining lectures, exhibitions, and opportunities to observe nature. The company has collected the following data on labor costs and number of visitors to the park over the last 30 months. Month Labor Cost Visitors 1 $ 26,420 2,300 2 $ 37,134 3,507 3 $ 40,897 3,803 4 $ 32,383 3,006 5 $ 35,618 3,211 6 $ 33,432 2,951 7 $ 32,767 2,983 8 $ 39,225 3,621 9 $ 39,464 3,735 10 $ 48,023 4,832 11 $ 43,137 4,026 12 $ 39,937 3,794 13 $ 35,244 3,268 14 $ 33,944 3,161 15 $ 37,831 3,393 16 $ 27,116 2,840 17 $ 31,376 4,595 18 $ 30,657 3,769 19 $ 28,232 3,263 20 $ 30,700 4,022 21 $ 26,289 2,705 22 $ 25,228 2,428 23 $ 29,563 4,420 24 $ 30,854 5,165 25 $ 28,773 3,507 26 $ 32,426 4,429 27 $ 29,317 4,044 28 $ 30,622 4,126 29 $ 29,099 3,398 30 $ 28,522 2,808 Required: a. Estimate the labor…Floyd Distributors, Inc., provides a variety of auto parts to small local garages. Floyd purchases parts from manufacturers according to the EOQ model and then ships the parts from a regional warehouse direct to its customers. For a particular type of muffler, Floyd's EOQ analysis recommends orders with Q* = 20 to satisfy an annual demand of 180 mufflers. Floyd's has 250 working days per year, and the lead time averages 15 days.Note: Use Appendix B to identify the areas for the standard normal distribution. What is the reorder point if Floyd assumes a constant demand rate? If required, round your answer up to the nearest whole number. r = fill in the blank 1 Suppose that an analysis of Floyd's muffler demand shows that the lead-time demand follows a normal probability distribution with µ = 12 and σ = 2.2. If Floyd's management can tolerate one stock-out per year, what is the revised reorder point? If required, round your answer up to the nearest whole number. r = fill in the blank…DATAfile: Jensen A statistical program is recommended. Jensen Tire & Auto is in the process of deciding whether to purchase a maintenance contract for its new computer wheel alignment and balancing machine. Managers feel that maintenance expense should be related to usage, and they collected the following information on weekly usage (hours) and annual maintenance expense (in hundreds of dollars). Weekly Usage(hours) AnnualMaintenanceExpense 13 17.0 10 22.0 20 30.0 28 37.0 32 47.0 17 30.5 24 32.5 31 39.0 40 51.5 38 40.0 (a) Develop the estimated regression equation that could be used to predict the annual maintenance expense (in hundreds of dollars) given the weekly usage (in hours). (Round your numerical values to two decimal places.) ŷ = (b) Test the significance of the relationship in part (a) at a 0.05 level of significance. (Use the F test.) State the null and alternative hypotheses. H0: ?1 ≠ 0Ha: ?1 = 0H0: ?1 = 0Ha: ?1 ≠ 0 H0: ?0 ≠…