
MATLAB: An Introduction with Applications
6th Edition
ISBN: 9781119256830
Author: Amos Gilat
Publisher: John Wiley & Sons Inc
expand_more
expand_more
format_list_bulleted
Related questions
Question
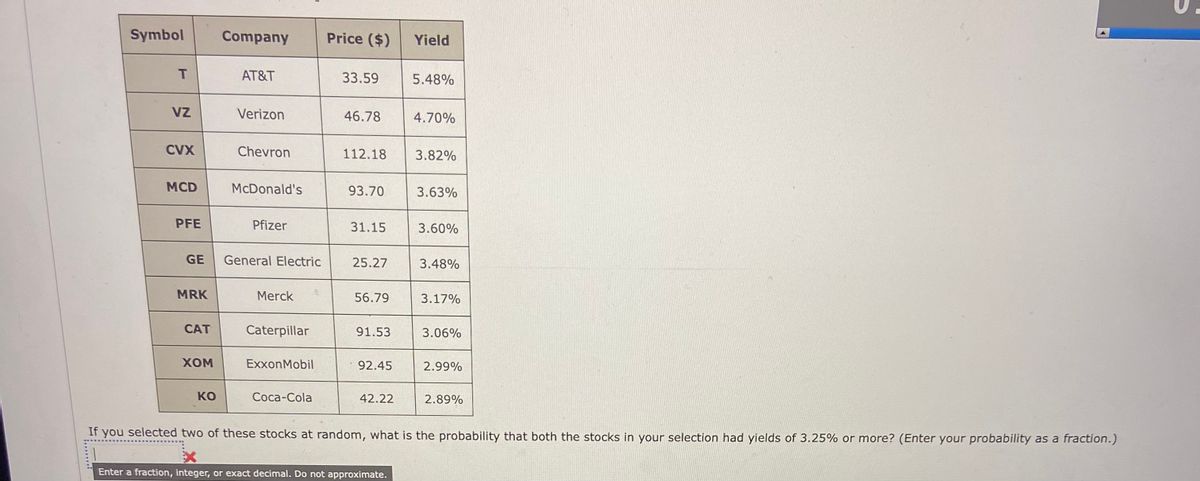

Transcribed Image Text:Symbol
Company
Price ($)
Yield
AT&T
33.59
5.48%
VZ
Verizon
46.78
4.70%
CVX
Chevron
112.18
3.82%
MCD
McDonald's
93.70
3.63%
PFE
Pfizer
31.15
3.60%
GE
General Electric
25.27
3.48%
MRK
Merck
56.79
3.17%
САТ
Caterpillar
91.53
3.06%
Хом
ExxonMobil
92.45
2.99%
ко
Соса-Cola
42.22
2.89%
If you selected two of these stocks at random, what is the probability that both the stocks in your selection had yields of 3.25% or more? (Enter your probability as a fraction.)
Enter a fraction, integer, or exact decimal. Do not approximate.
Expert Solution
This question has been solved!
Explore an expertly crafted, step-by-step solution for a thorough understanding of key concepts.

This is a popular solution

Trending nowThis is a popular solution!

Step by stepSolved in 2 steps

Knowledge Booster

Similar questions
- Hotel Overall Comfort Amenities In-House Dining Muri Beach Odyssey 94.3 94.5 90.8 97.7 Pattaya Resort 92.9 96.6 84.1 96.6 Sojourner’s Respite 92.8 99.9 100.0 88.4 Spa Carribe 91.2 88.5 94.7 97.0 Penang Resort and Spa 90.4 95.0 87.8 91.1 Mokihana Hōkele 90.2 92.4 82.0 98.7 Theo’s of Cape Town 90.1 95.9 86.2 91.9 Cap d’Agde Resort 89.8 92.5 92.5 88.8 Spirit of Mykonos 89.3 94.6 85.8 90.7 Turismo del Mar 89.1 90.5 83.2 90.4 Hotel Iguana 89.1 90.8 81.9 88.5 Sidi Abdel Rahman Palace 89.0 93.0 93.0 89.6 Sainte-Maxime Quarters 88.6 92.5 78.2 91.2 Rotorua Inn 87.1 93.0 91.6 73.5 Club Lapu-Lapu 87.1 90.9 74.9 89.6 Terracina Retreat 86.5 94.3 78.0 91.5 Hacienda Punta Barco 86.1 95.4 77.3 90.8 Rendezvous Kolocep 86.0 94.8 76.4 91.4 Cabo de Gata Vista 86.0 92.0 72.2 89.2 Sanya Deluxe 85.1 93.4 77.3 91.8arrow_forwardIf the base of a deareased by 25% but the altituda is Tucveased by lo%, by what % is the avea chaned ? Refer to vectaugle is Saction 8.1 Eeaple2arrow_forwardAmount 20.50 14.63 23.77 29.96 29.49 32.70 9.20 20.89 28.87 15.78 18.16 12.16 11.22 16.43 17.66 9.59 18.89 19.88 23.11 20.11 20.34 20.08 30.36 21.79 21.18 19.22 34.13 27.49 36.55 18.37 32.27 12.63 25.53 27.71 33.81 21.79 19.16 26.35 20.01 26.85 13.63 17.22 13.17 20.12 22.11 22.47 20.36 35.47 11.85 17.88 6.83 30.99 14.62 18.38 26.85 25.10 27.55 25.87 14.37 15.61 26.46 24.24 16.66 20.85arrow_forward
- Miles (1000s) Price ($1000s) 116.53 25.6 100.27 22.2 29.93 43.3 25.47 27.6 49.96 36.2 83.68 29.8 62.53 24.3 85.54 32.8 27.93 35.0 89.31 23.6 59.89 25.5 17.87 23.6 20.35 29.2 116.65 24.7 63.18 25.0 30.54 37.8 51.36 19.6 34.83 46.2 93.06 27.1 116.49 17.7 68.08 22.5 29.90 26.6 39.98 25.6 98.06 22.2 44.43 26.0 22.90 39.9 52.13 32.3 57.72 21.8 67.89 23.6 61.77 36.4 46.90 24.6 57.89 21.4 94.41 21.4 50.73 22.2 41.88 22.5 110.06 27.0 22.25 40.2 57.00 26.7 15.73 26.8 99.87 22.9 98.30 30.2 90.12 15.3 31.55 32.5 30.47 30.6 33.28 36.0 52.94 18.1 17.60 29.6 88.29 38.4 90.98 23.8 75.39 25.0 28.20 22.3 102.03 30.3 28.38 31.4 45.44 36.3 44.82 37.2 74.81 26.3 33.22 40.9 29.30 29.1 17.73 35.9 53.33 31.7 31.54 44.5 30.83 43.4 51.38 41.0 53.26 32.2 15.61 32.3 101.39 24.6 77.04 26.8 86.47 20.5 119.18 19.3 35.96 33.6 99.38 27.1 103.17 33.2 37.72 25.4 75.59 21.2…arrow_forwardCrude Oil Refiner Acquisition costs (Dollars per Barrel) Date Domestic Imported Composite 940101 12.55 12.81 12.69 940201 13.18 12.91 13.04 940301 13.09 13.15 13.12 940401 14.66 14.46 14.55 940501 15.57 15.65 15.61 940601 17.23 17.08 17.15 940701 17.51 17.93 17.73 940801 17.06 17.08 17.07 940901 16.32 15.89 16.09 941001 16.21 16.40 16.30 941101 16.49 16.54 16.51 941201 16.10 15.76 15.95 950101 16.37 16.62 16.49 950201 16.98 17.25 17.11 950301 17.21 17.24 17.23 950401 18.08 18.84 18.43 950501 18.57 18.49 18.53 950601 17.84 17.40 17.62 950701 16.78 16.45 16.62 950801 16.89 16.54 16.72 950901 16.96 16.73 16.85 951001 16.72 16.34 16.53 951101 16.61 16.53 16.57 951201 17.31 17.61 17.46 960101 17.85 17.55 17.70 960201 18.04 17.70 17.88 960301 19.49 19.81 19.64 960401 21.77 21.05 21.44 960501 21.09 20.00 20.51 960601 18.93 18.83 18.87arrow_forwardMonthly Sales 6267.19 7058.06 7119.5 7147.18 7198.52 7298.09 7325.7 7335.68 7355.97 7481.05 7490.23 7530.08 7616.09 7682.69 7684.14 7704.12 7704.98 7779.28 7798.23 7815.15 7844.16 7890.21 7977.6 7993.16 8021.03 8028.37 8068.86 8082.42 8096.17 8119.25 8129.21 8190.68 8255.28 8282.44 8376.31 8392.4 8400.95 8451.16 8456.66 8505.35 8539.25 8543.65 8573.05 8641.78 8667.48 8751.08 8777.97 8800.08 8888.65 8907.03 9096.87 9241.74 9411.68 9450.73 9484.62 9514.57 9521.4 9524.91 9733.44 10123.24 Given the company’s performance record and based on the empirical rule of normal distribution (also known as the 68%-95%-99.7% rule), what would be the lower bound of the range of sales values that contains 68% of the monthly sales? What would be the upper bound of the range of sales values that contains 68% of the monthly sales?arrow_forward
- Hotel Overall Comfort Amenities In-House Dining Muri Beach Odyssey 94.3 94.5 90.8 97.7 Pattaya Resort 92.9 96.6 84.1 96.6 Sojourner’s Respite 92.8 99.9 100.0 88.4 Spa Carribe 91.2 88.5 94.7 97.0 Penang Resort and Spa 90.4 95.0 87.8 91.1 Mokihana Hōkele 90.2 92.4 82.0 98.7 Theo’s of Cape Town 90.1 95.9 86.2 91.9 Cap d’Agde Resort 89.8 92.5 92.5 88.8 Spirit of Mykonos 89.3 94.6 85.8 90.7 Turismo del Mar 89.1 90.5 83.2 90.4 Hotel Iguana 89.1 90.8 81.9 88.5 Sidi Abdel Rahman Palace 89.0 93.0 93.0 89.6 Sainte-Maxime Quarters 88.6 92.5 78.2 91.2 Rotorua Inn 87.1 93.0 91.6 73.5 Club Lapu-Lapu 87.1 90.9 74.9 89.6 Terracina Retreat 86.5 94.3 78.0 91.5 Hacienda Punta Barco 86.1 95.4 77.3 90.8 Rendezvous Kolocep 86.0 94.8 76.4 91.4 Cabo de Gata Vista 86.0 92.0 72.2 89.2 Sanya Deluxe 85.1 93.4 77.3 91.8arrow_forwardhow to calculate the residual value? Service Subscriptions Web Page Hits Adv Price 1 37.95 588.9 13.2 35.1 2 37.66 585.3 13.2 34.7 3 37.55 566.3 19.8 34.8 4 38.78 642.9 17.6 35.1 5 37.67 624.2 17.6 34.6 6 38.23 603.9 15.4 34.8 7 36.9 571.9 11 34.7 8 38.28 584.3 28.6 35.3 9 38.95 605 28.6 35.1 10 39.27 676.3 17.6 35.6 11 38.3 587.4 17.6 34.9 12 38.84 576.4 22 35.4 13 38.14 570.8 17.6 35 14 38.39 586.5 15.4 35.5 15 37.29 544 11 34.9 16 39.15 611.1 24.2 35 17 38.29 643.3 17.6 35.3 18 38.09 635.6 19.8 34.8 19 37.83 598.9 15.4 35.1 20 39.37 657 22 35.3 21 37.81 595.2 15.4 35.1 22 37.42 520 19.8 35.1 23 38.83 629.6 22 35.3 24 38.33 680 24.2 34.7 25 40.24 651.2 33 35.8arrow_forwardCourse Eval Prof Eval4.0 4.64.5 4.74.0 3.94.3 4.74.3 4.94.3 4.63.9 4.63.3 3.14.7 5.04.1 3.93.1 3.44.1 4.34.0 4.33.2 3.62.7 3.14.6 4.33.7 4.74.1 4.04.5 4.73.4 3.63.4 3.53.3 3.34.4 4.44.5 4.34.1 4.54.5 4.64.2 4.74.0 4.33.5 3.84.3 4.42.4 2.23.6 4.34.7 4.74.0 4.14.2 3.94.4 4.14.0 4.14.0 3.94.1 4.04.8 4.83.4 3.14.5 4.53.4 3.23.9 3.84.6 4.34.7 4.93.3 3.93.7 4.04.0 4.54.1 4.24.2 4.34.0 4.04.5 4.83.7 4.43.2 3.53.5 3.93.9 3.94.3 4.03.1 3.63.2 3.24.1 4.44.1 4.53.4 3.93.6 3.94.5 4.33.7 3.64.1 4.62.2 2.12.7 3.34.1 4.73.3 3.54.5 4.83.4 4.23.5 4.13.7 3.84.2 4.53.8 4.64.2 4.33.7 4.04.9 5.13.7 3.43.5 3.43.5 4.34.7 4.84.6 5.04.1 4.73.0 3.43.4 3.53.5 3.84.1 4.23.9 3.94.3 4.43.4 3.3arrow_forward
- 3.59 3.59 4.79 3.56 3.55 3.71 3.65 3.6 3.75 3.56 3.57 3.59 3.55 3.99 4.15 3.66 3.63 3.73 3.61 3.57 1. Until five months ago, suppose the average weekly gas price had remained stable around $3.55, but a shock to supply seemed to push prices higher thereafter. Let’s test whether this is so using our data. 2. Develop the H0 and Ha hypotheses. Is it a lower-, upper-, or two-tailed test? ii. Let α = .05. What probability does α represent? 3. Assume σ = 0.30 and compute the test statistic.arrow_forwardUse the data from the following four stocks to answer the questions below: Yields Year TLS DI PFE WMT 20x5 12.00% 4.50% 5.80% 11.30% 20x6 13.30% 5.30% 5.70% 9.00% 20x7 10.20% 3.10% 5.90% 13.90% 20x8 9.30% 2.70% 4.50% 14.80% 20x9 8.60% 1.90% 6.30% 15.00% a. Classify the correlations between each pair of stocks as positive correlation (PC), perfectly positive correlation (PPC), negative correlation (NC), perfectly negative correlation (PNC), and no correlation (NC): TLS – DI ___________ DI – PFE __________ TLS – PFE __________ DI – WMT _________ TLS – WMT _________ PFE – WMT _________arrow_forward10 The observed insurance policy deviates from the predicted policy, on average, by _______ ($1,000) a 44.465 b 49.406 c 54.895 d 60.994arrow_forward
arrow_back_ios
SEE MORE QUESTIONS
arrow_forward_ios
Recommended textbooks for you
- MATLAB: An Introduction with ApplicationsStatisticsISBN:9781119256830Author:Amos GilatPublisher:John Wiley & Sons Inc
 Probability and Statistics for Engineering and th...StatisticsISBN:9781305251809Author:Jay L. DevorePublisher:Cengage Learning
 Statistics for The Behavioral Sciences (MindTap C...StatisticsISBN:9781305504912Author:Frederick J Gravetter, Larry B. WallnauPublisher:Cengage Learning
  Elementary Statistics: Picturing the World (7th E...StatisticsISBN:9780134683416Author:Ron Larson, Betsy FarberPublisher:PEARSON
 The Basic Practice of StatisticsStatisticsISBN:9781319042578Author:David S. Moore, William I. Notz, Michael A. FlignerPublisher:W. H. Freeman
 Introduction to the Practice of StatisticsStatisticsISBN:9781319013387Author:David S. Moore, George P. McCabe, Bruce A. CraigPublisher:W. H. Freeman
MATLAB: An Introduction with Applications
Statistics
ISBN:9781119256830
Author:Amos Gilat
Publisher:John Wiley & Sons Inc
Probability and Statistics for Engineering and th...
Statistics
ISBN:9781305251809
Author:Jay L. Devore
Publisher:Cengage Learning
Statistics for The Behavioral Sciences (MindTap C...
Statistics
ISBN:9781305504912
Author:Frederick J Gravetter, Larry B. Wallnau
Publisher:Cengage Learning
Elementary Statistics: Picturing the World (7th E...
Statistics
ISBN:9780134683416
Author:Ron Larson, Betsy Farber
Publisher:PEARSON
The Basic Practice of Statistics
Statistics
ISBN:9781319042578
Author:David S. Moore, William I. Notz, Michael A. Fligner
Publisher:W. H. Freeman
Introduction to the Practice of Statistics
Statistics
ISBN:9781319013387
Author:David S. Moore, George P. McCabe, Bruce A. Craig
Publisher:W. H. Freeman