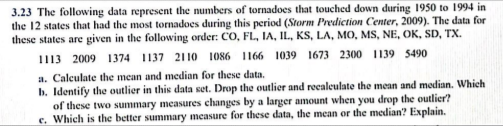
3.23 The following data represent the numbers of tornadoes that touched down during 1950 to 1994 in the 12 states that had the most tornadoes during this period (Storm Prediction Center, 2009). The data for these states are given in the following order: CO, FL, IA, IL, KS, LA, MO, MS, NE, OK, SD, TX. 1113 2009 1374 1137 2110 1086 1166 1039 1673 2300 1139 5490 a. Calculate the mean and median for these data. b. Identify the outlier in this data set. Drop the outlier and reealeulate the mean and median. Which of these two summary measures changes by a larger amount when you drop the outlier? Which is the better summary measure for these data, the mean or the median? Explain.
3.23 The following data represent the numbers of tornadoes that touched down during 1950 to 1994 in the 12 states that had the most tornadoes during this period (Storm Prediction Center, 2009). The data for these states are given in the following order: CO, FL, IA, IL, KS, LA, MO, MS, NE, OK, SD, TX. 1113 2009 1374 1137 2110 1086 1166 1039 1673 2300 1139 5490 a. Calculate the mean and median for these data. b. Identify the outlier in this data set. Drop the outlier and reealeulate the mean and median. Which of these two summary measures changes by a larger amount when you drop the outlier? Which is the better summary measure for these data, the mean or the median? Explain.

MATLAB: An Introduction with Applications
6th Edition
ISBN:9781119256830
Author:Amos Gilat
Publisher:Amos Gilat
Chapter1: Starting With Matlab
Section: Chapter Questions
Problem 1P

Related questions
Question
Transcribed Image Text:3.23 The following data represent the numbers of tornadoes that touched down during 1950 to 1994 in
the 12 states that had the most tornadoes during this period (Storm Prediction Center, 2009). The data for
these states are given in the following order: CO, FL, IA, IL, KS, LA, MO, MS, NE, OK, SD, TX.
1113 2009 1374 1137 2110 1086 1166 1039 1673 2300 1139 5490
a. Calculate the mean and median for these data.
b. Identify the outlier in this data set. Drop the outlier and recaleulate the mean and median. Which
of these two summary measures changes by a larger amount when you drop the outlier?
e. Which is the better summary measure for these data, the mean or the median? Explain.
Expert Solution
This question has been solved!
Explore an expertly crafted, step-by-step solution for a thorough understanding of key concepts.

This is a popular solution!

Trending now
This is a popular solution!

Step by step
Solved in 2 steps

Recommended textbooks for you
MATLAB: An Introduction with Applications
Statistics
ISBN:
9781119256830
Author:
Amos Gilat
Publisher:
John Wiley & Sons Inc

Probability and Statistics for Engineering and th…
Statistics
ISBN:
9781305251809
Author:
Jay L. Devore
Publisher:
Cengage Learning

Statistics for The Behavioral Sciences (MindTap C…
Statistics
ISBN:
9781305504912
Author:
Frederick J Gravetter, Larry B. Wallnau
Publisher:
Cengage Learning
MATLAB: An Introduction with Applications
Statistics
ISBN:
9781119256830
Author:
Amos Gilat
Publisher:
John Wiley & Sons Inc
Probability and Statistics for Engineering and th…
Statistics
ISBN:
9781305251809
Author:
Jay L. Devore
Publisher:
Cengage Learning
Statistics for The Behavioral Sciences (MindTap C…
Statistics
ISBN:
9781305504912
Author:
Frederick J Gravetter, Larry B. Wallnau
Publisher:
Cengage Learning

Elementary Statistics: Picturing the World (7th E…
Statistics
ISBN:
9780134683416
Author:
Ron Larson, Betsy Farber
Publisher:
PEARSON

The Basic Practice of Statistics
Statistics
ISBN:
9781319042578
Author:
David S. Moore, William I. Notz, Michael A. Fligner
Publisher:
W. H. Freeman

Introduction to the Practice of Statistics
Statistics
ISBN:
9781319013387
Author:
David S. Moore, George P. McCabe, Bruce A. Craig
Publisher:
W. H. Freeman