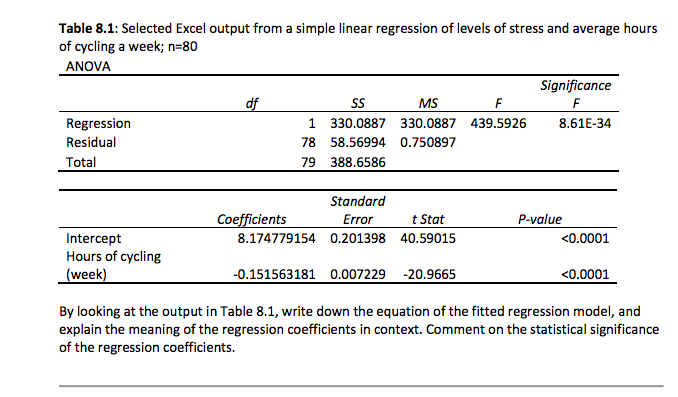
Table 8.1: Selected Excel output from a simple linear regression of levels of stress and average hours of cycling a week; n=80 ANOVA Significance df MS F F 1 330.0887 Regression Residual 330.0887 439.5926 8.61E-34 78 58.56994 0.750897 Total 79 388.6586 Standard Coefficients Error t Stat P-value <0.0001 Intercept Hours of cycling 8.174779154 0.201398 40.59015 (week) -0.151563181 0.007229 -20.9665 <0.0001 By looking at the output in Table 8.1, write down the equation of the fitted regression model, and explain the meaning of the regression coefficients in context. Comment on the statistical significance of the regression coefficients.
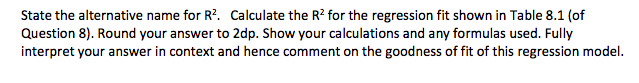
Q: Based on the regression results, what is the predicted amount withdrawn for a male who spends 38 at…
A: From the given output, the regression equation is…
Q: a were collected to determine the relationship nool rank in class and the grade-point average at nan…
A: *Answer: Given data and calculation is shown below Decile Rank(x) Grade Point Average(y) x2 y2…
Q: b-2. At the 5% significance level, what is the conclusion to the test? multiple choice 2 Do not…
A: b-1) The null and alternative hypotheses are H0: β1 = 0; HA: β1 ≠ 0 b-2) Since the p-value is…
Q: In a simple linear regression analysis of 10 observations, the following partial ANOVA table was…
A: ANOVA for simple linear regression: Source SS df MS F Regression SSreg 1 MSreg=SSreg1…
Q: Following is a portion of the regression output for an application relating maintenance expense…
A:
Q: what is the critical value (using the 5% level of significance)? (please express your answer using 2…
A: The degrees of freedom is, df=N-K-1=50-3-1=46 The degrees of freedom is 46. The level of…
Q: 1. ( You run a regression of monthly returns of Textron, an industrial conglomerate, on the S&P s00…
A: From the above outputs X (independent variable) - proportion of market risk Y(dependent variable) -…
Q: We wish to estimate the effect of weight on serum cholesterol (S. C.) level in healthy females aged…
A: Simple linear regression model: A simple linear regression model is given as y^ = b0 + bx + e…
Q: Based on the regression results, when testing the hypothesis that the coefficient on SECONDS is…
A: Formulating Hypothesis : Null : H0 : β2 = 0 Alternate : Ha : β2 ≠ 0
Q: The following results are from data concerning the amount withdrawn from an ATM machine based on the…
A: Test whether MHPG significantly predict affect or not: The investigator is specially interested to…
Q: A study was done to compare tree height with trunk thickness. The following output was generated…
A: The estimate and standard error of trunk is 8.668677 and 3.670058, respectively.
Q: The following results are from data concerning the amount withdrawn from an ATM machine based on the…
A: From the given information, the regression equation can be written as follows:…
Q: Based on the regression results, what is the standard error of the error terms? (please express your…
A: Based on the regression results, what is the standard error of the error terms? (please express your…
Q: Table 8.1: Selected Excel output from a simple linear regression of levels of stress and average…
A: In this case, the independent variable is hours of cycling (x) and the dependent variable is levels…
Q: 1. Plot the data points on a scatter diagram. 2. Determine the equation of the regression line and…
A:
Q: A multiple regression analysis produced the following output from Minitab. Regression Analysis: Y…
A: Here as we can see the p-value for both the variables X1 and X2 is greater than 0.05 so none of the…
Q: 9. A regression between foot length (response variable in cm) and height (explanatory variable in…
A: Let define the variables: x = height of the students y =Foot length of the students The given…
Q: The price X (dollars per pound) and consumption y (in pounds per capita) of beef were samples for 10…
A: Solution: From the given information, Then,
Q: Consider the following regression estimates (FNB) Source MS Number of obs 500 F(2, 497) Prob > F…
A: The formula for coefficient of determination or R-squared is, R2 = SSModel/SSTotal.
Q: What is a control variable, and how does it differ from a variable of interest?Looking at Table,…
A: Introduction: A control variable is a variable that has the potential to affect the response…
Q: The following results were obtained when each of a series of standard silver solutions was analyzed…
A: Hello! As you have posted more than 3 sub parts, we are answering the first 3 sub-parts. In case…
Q: chp 14 (8)
A: a. State the null and alternative Hypotheses: Null Hypothesis: H0: There is no significant…
Q: ased on the regression results, what is the predicted amount withdrawn for a female who spends 29 at…
A: The regression line which can be obtained from the given output is,
Q: You are given the following data, where X1X1 (years of working experience at current position) and…
A: Excel Procedure: Enter Y, X1, X2 in Excel>Data>Data Analysis> ‘Regression’>Select Y…
Q: An article in the Journal of Sound and Vibration (Vol. 151, 1991, pp. 383-394) described a study…
A: Answer : for the answer of all questions first we want to perform regression analysis. By Use…
Q: 3. The signal (peak area) measured for different standard concentrations of silver in atomic…
A: From the given information, Consider, Y = peak area that needs to be measured and X1 =Ag , X2 =…
Q: The following shows incomplete ANOVA output: ANOVA Regression Residual Total Calculate: P= 1 df 1 8…
A: Given that dfRegression = 1 , dfResidual = 8 , dfTotal = 9 SSTotal = 2335 , MSResidual = 140.1…
Q: An article in the Journal of Sound and Vibration (Vol. 151, 1991, pp. 383-394) described a study…
A: The dependent variable is y. The independent variable is x. We have to find the p-value of the…
Q: Consider the multiple regression model shown next between the dependent variable Y and four…
A: Solution: Given information: n= 35 observation k = 4 independent variables Sum of square of…
Q: A part of the output of a regression analysis of Y against X using Excel is given below: SUMMARY…
A: From the Given information Intercept= 45.2159 Slope =5.3265 Estimated regression line is y =…
Q: Consider the following OLS regression output which is estimated with Wage2.dta (see tutorial folder…
A: The econometrics model is fitted for dependent and independent variables. The given model is…
Q: A multiple regression analysis to assess the effects of age and wage ($/hr) on productivity units…
A: Regression Analysis: Regression analysis is used measure the association between two or more…
Q: Given the regression output below and a significance level of 99%, can we reject the null hypothesis…
A: Given that p-value =0.000 Level of significance =0.01
Q: You estimated a regression with the following output. Source | SS df…
A: From the output, Coefficient of X is 5.299 Constant term is 67.867. Regression Equation:…
Q: stats chp 14 (12)
A: Given data
Q: Consider the following OLS regression output which is estimated with Wage2.dta (see tutorial folder…
A: Solution: The regression output is given.
Q: Consider the following regression estimates Source SS df Model 44.5315181 Residual 103.798233 Total…
A: Multiple regression has more than one predictor or independent variables.
Q: Consider the following computer output from a multiple regression analysis relating the price of a…
A: Given info: The multiple analysis relating the price of a used car to the variables: age of car,…
Q: 1 SUMMARY OUTPUT (2 paprameters - age group + grocery shopping frequency) 2 Regression Statistics 4…
A: Given regression results
Q: Consider the following estimated regression with a sample of size n=50: AHE = -2.44 – 1.57 • DFemale…
A: Given: AHE^=-2.44-1.57×DFemale+0.27×DMarried+0.59×Educ+0.04×Exper and the scatter plot
Q: Assume no assumptions are violated. Form a 87% Confidence interval for how much your final is…
A: Confidence interval determines the two bounds within which the population parameter is supposed to…
Q: Based on the table below, what is the value of SST? (round to 2 decimal places) ANOVA df SS MS F…
A: Given: SSRegression=28.06SSResidual=12.09 The value of Sum of squares of total SST is obtained as…
Q: An article in the Journal of Sound and Vibration (Vol. 151, 1991, pp. 383-394) described a study…
A:
Q: The following results are from data concerning the amount withdrawn from an ATM machine based on the…
A: From the given output, the value of R is 0.503. The value of R2 is (0.503)2 is 0.253 The amount of…
Q: table 7 autocorrelations of the residuals from estimating the regression ΔgPMt = 0.0006 − 0.33301…
A: Given that,
Q: Suppose we run a simple regression model where n= 10000, and find the following estimates and…
A: The slope is 0.033, and standard error is 0.116.
Q: Consider the following regression estimates (FN6) Source SS df MS Number of obs = 526 64.11 F(3,…
A: Solution: The regression output is given.
Q: The following results are from data concerning the amount withdrawn from an ATM machine based on the…
A:
Q: Following is a portion of the regression output for an application relating maintenance expense…
A: Answer is given below:
Trending now
This is a popular solution!
Step by step
Solved in 2 steps with 2 images
- Olympic Pole Vault The graph in Figure 7 indicates that in recent years the winning Olympic men’s pole vault height has fallen below the value predicted by the regression line in Example 2. This might have occurred because when the pole vault was a new event there was much room for improvement in vaulters’ performances, whereas now even the best training can produce only incremental advances. Let’s see whether concentrating on more recent results gives a better predictor of future records. (a) Use the data in Table 2 (page 176) to complete the table of winning pole vault heights shown in the margin. (Note that we are using x=0 to correspond to the year 1972, where this restricted data set begins.) (b) Find the regression line for the data in part ‚(a). (c) Plot the data and the regression line on the same axes. Does the regression line seem to provide a good model for the data? (d) What does the regression line predict as the winning pole vault height for the 2012 Olympics? Compare this predicted value to the actual 2012 winning height of 5.97 m, as described on page 177. Has this new regression line provided a better prediction than the line in Example 2?A researcher notes that, in a certain region, a disproportionate number of software millionaires were born around the year 1955. Is this a coincidence, or does birth year matter when gauging whether a software founder will besuccessful? The researcher investigated this question by analyzing the data shown in the accompanying table. Complete parts a through c below. a. Find the coefficient of determination for the simple linear regression model relating number (y) of software millionaire birthdays in a decade to total number (x) of births in the region. Interpret the result. The coefficient of determination is 1.___? (Round to three decimal places as needed.) This value indicates that 2.____ of the sample variation in the number of software millionaire birthdays is explained by the linear relationship with the total number of births in the region. (Round to one decimal place as needed.) b. Find the coefficient of determination for the simple linear regression model…table 7 autocorrelations of the residuals from estimating the regression ΔgPMt = 0.0006 − 0.33301 ΔgPMt −1 + εt 1Q:1992–4Q:2001 (40 Observations) regression Statistics R-squared Standard error Observations Durbin–watson intercept ΔgPMt −1 ΔgPMt −4 Coefficient −0.0001 −0.0608 0.8720 0.9155 0.0057 40 2.6464 Standard error 0.0009 0.0687 0.0678 t-Statistic −0.0610 −0.8850 12.8683 lag 1 2 3 4 5 autocorrelation −0.1106 −0.5981 −0.1525 0.8496 −0.1099 table 8 shows the output from a regression on changes in the gPM for home Depot, where we have changed the specification of the ar regression. table 8 Change in gross Profit Margin for home Depot 1Q:1992–4Q:2001 a. identify the change that was made to the regression model. b. Discuss the rationale for changing the regression specification
- The operations manager of a musical instrument distributor feels that the demand for Bass Drums may be related to the number of television appearances by the popular rick group Green Shades during the previous month. The manager has collected the data shown in the following table. Demand for Bass Drums 3 6 7 5 10 8 Green Shades TV appearances 3 4 7 6 8 5 Develop the linear regression equation to forecast. Forecast demand for Bass Drums when Green Shades’ TV appearances are 10. Compute MSE and standard deviation for Problem 8.The Update to the Task Force Report on Blood Pressure Control in Children [12] reported the observed 90th per-centile of SBP in single years of age from age 1 to 17 based on prior studies. The data for boys of average height are given in Table 11.18. Suppose we seek a more efficient way to display the data and choose linear regression to accomplish this task. age sbp 1 99 2 102 3 105 4 107 5 108 6 110 7 111 8 112 9 114 10 115 11 117 12 120 13 122 14 125 15 127 16 130 17 132 Do you think the linear regression provides a good fit to the data? Why or why not? Use residual analysis to justify your answer. Am I supposed to run a residual plot and QQ-plot for this question?The following is a partial computer output of a multiple regression analysis of a data set containing 20 sets of observations on the dependent variableThe regression equation isSALEPRIC = 1470 + 0.814 LANDVAL + 0.820 IMPROVAL + 13.5 AREA Predictor Coef SE Coef T P Constant 1470 5746 0.26 0.801 LANDVAL 0.8145 0.5122 1.59 0.131 IMPROVAL 0.8204 0.2112 3.88 0.0001 AREA 13.529 6.586 2.05 0.057 S = 79190.48 R-Sq = 89.7% R-Sq(adj) = 87.8% Analysis of Variance Source DF SS MS Regression 3 8779676741 2926558914 Residual Error 16 1003491259 62718204 Total 19 9783168000 For the problem above, we want to carry out the significance test about the coefficient of LANDVAL, what is the t-value for this test, and is it significant? 46.66, significant 2.05, significant 1.59, not significant 0.26, not significant
- Consider the following estimated regression model relating annual salary to years of education and work experience. Estimated Salary=10,815.11+2563.46(Education)+897.49(Experience)Estimated Salary=10,815.11+2563.46(Education)+897.49(Experience) Suppose two employees at the company have been working there for five years. One has a bachelor's degree (88 years of education) and one has a master's degree (1010 years of education). How much more money would we expect the employee with a master's degree to make?Consider the following sample of production volumes and total cost data for a manufacturing operation. Production Volume(units) Total Cost($) 400 4,000 450 4,900 550 5,300 600 5,900 700 6,400 750 7,000 This data was used to develop an estimated regression equation, ŷ = 1,121.33 + 7.76x, relating production volume and cost for a particular manufacturing operation. Use ? = 0.05 to test whether the production volume is significantly related to the total cost. (Use the F test.) State the null and alternative hypotheses. -H0: ?1 ≠ 0Ha: ?1 = 0 -H0: ?1 ≥ 0Ha: ?1 < 0 -H0: ?0 ≠ 0Ha: ?0 = 0 -H0: ?1 = 0Ha: ?1 ≠ 0 -H0: ?0 = 0Ha: ?0 ≠ 0 Set up the ANOVA table. (Round your p-value to three decimal places and all other values to two decimal places.) Sourceof Variation Sumof Squares Degreesof Freedom MeanSquare F p-value Regression ? ? ? ? ? Error ? ? ? Total ? ? Find the value of the test statistic. (Round your answer to two decimal places.) Test…If the standard error of the estimate for a regression model fitted to a large number of paired observations is 1.75, approximately 95% of the residuals would lie within ______. −3.50 and +3.50 −1.75 and +1.75 −0.95 and +0.95 −0.68 and +0.68 −0.97 and +0.97
- The following table shows the annual number of PhD graduates in a country in various fields. NaturalSciences Engineering SocialSciences Education 1990 70 10 70 30 1995 130 40 110 50 2000 330 130 280 140 2005 490 370 460 210 2010 590 550 830 520 2012 690 590 1,000 900 (a) With x = the number of social science doctorates and y = the number of education doctorates, use technology to obtain the regression equation. (Round coefficients to three significant digits.) y(x) = Graph the associated points and regression line. (b) What does the slope tell you about the relationship between the number of social science doctorates and the number of education doctorates? The slope tells us the increase in the number of social science doctorates for each additional education doctorate.The slope tells us the increase in the number of education doctorates for each additional social science doctorate. The slope tells us the decrease in the number…The following table shows the annual number of PhD graduates in a country in various fields. NaturalSciences Engineering SocialSciences Education 1990 70 10 60 30 1995 130 40 120 50 2000 330 130 280 140 2005 490 370 460 210 2010 590 550 830 520 2012 690 590 1,000 900 (a) With x = the number of social science doctorates and y = the number of education doctorates, use technology to obtain the regression equation. (Round coefficients to three significant digits.) y(x) = Graph the associated points and regression line. (b) What does the slope tell you about the relationship between the number of social science doctorates and the number of education doctorates? The slope tells us the increase in the number of education doctorates for each additional social science doctorate.The slope tells us the decrease in the number of education doctorates for each additional social science doctorate. The slope tells us the increase in the number…The following table displays the EPA fuel efficiency estimates (in miles per gallon) and the curbweight (in pounds) for a random sample of current year model vehicles.MPG 23 18 28 19 25 17 18 14Weight 3184 3598 2734 4082 2623 4685 4178 5488(a) Determine the linear regression model that will best predict the EPA fuel efficiency estimates(MPG) of a vehicle based on its curb weight.(b) How well does the linear regression model fit this sample data?(c) For a vehicle that weighs 4000 pounds, predict its EPA fuel efficiency estimate.