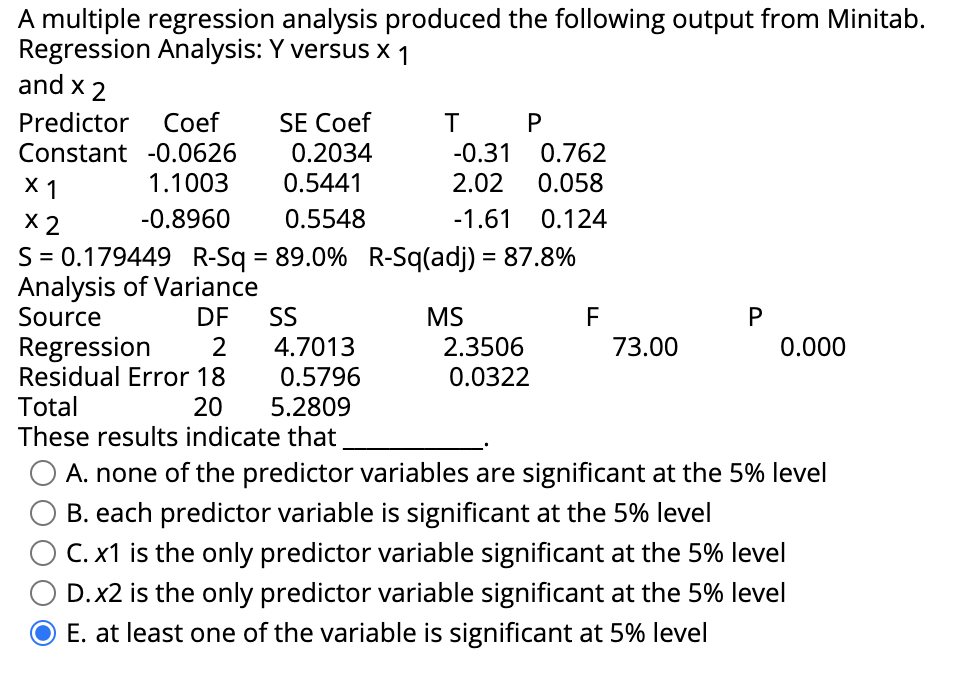
A multiple regression analysis produced the following output from Minitab. Regression Analysis: Y versus X 1 and x 2 SE Coef 0.2034 Predictor Сoef T 0.762 0.058 Constant -0.0626 -0.31 X 1 1.1003 0.5441 2.02 X 2 -0.8960 0.5548 -1.61 0.124 S = 0.179449 R-Sq = 89.0% R-Sq(adj) = 87.8% Analysis of Variance Source %3D DF SS MS Regression Residual Error 18 2 4.7013 2.3506 73.00 0.000 0.5796 0.0322 Total These results indicate that O A. none of the predictor variables are significant at the 5% level 20 5.2809 B. each predictor variable is significant at the 5% level C. x1 is the only predictor variable significant at the 5% level D.x2 is the only predictor variable significant at the 5% level O E. at least one of the variable is significant at 5% level


Angles in Circles
Angles within a circle are feasible to create with the help of different properties of the circle such as radii, tangents, and chords. The radius is the distance from the center of the circle to the circumference of the circle. A tangent is a line made perpendicular to the radius through its endpoint placed on the circle as well as the line drawn at right angles to a tangent across the point of contact when the circle passes through the center of the circle. The chord is a line segment with its endpoints on the circle. A secant line or secant is the infinite extension of the chord.
Arcs in Circles
A circular arc is the arc of a circle formed by two distinct points. It is a section or segment of the circumference of a circle. A straight line passing through the center connecting the two distinct ends of the arc is termed a semi-circular arc.
R3


Trending now
This is a popular solution!

Step by step
Solved in 2 steps


