

Q: A student adds too much HCI during the titration. Will the calculated Ksp be too high, too low, or…
A: Given that HCl is added in excess during the titration. Since HCl is a source of H+(aq) that reacts…
Q: of the following statements is incorrect O A standard solution should react completely with the…
A: Incorrect statement is:
Q: From the K, values for fumarate, Kp1 = 3.03 × 10⁻¹⁰ and Km = 1.05 × 10⁻¹¹, calculate the two K,…
A:
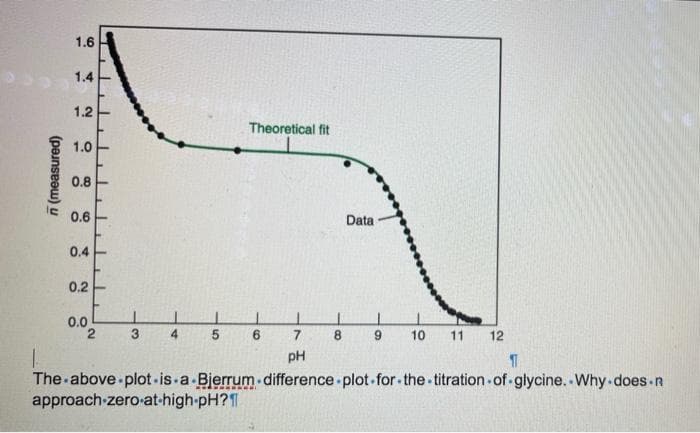
Q: Chikana experimentally determined the ionization constant of a weak monoprotic acid Chumami (Λ0 =…
A: Since you have posted a question with multiple sub-parts, we will solve first three subparts for…
Q: One of the following statements is incorrect: O A standard solution should react completely with the…
A: The solution is given below -
Q: Nitrous acid-observation is gas bubbles Hinsberg test-obsersvation is one layer. THen acid is added…
A: Hinsberg test is a chemical test used to distinguish between primary, secondary and tertiary amines.…
Q: is 4-bromoaniline soluble in HCl or NaOH or NaHCO3? please provide detailed description why that is?
A: Polar compounds are those when dissolved in water produce two charged species that is cations…
Q: For which titration is phenolphthalein the best choice? Explain your reasoning and support with…
A: Titration is a technique in which a solution of known concentration is treated with a solution of…
Q: Match the relational phrases to the corresponding concepts. Zwitterion Isoelectric Titration point…
A:
Q: Chikana experimentally determined the ionization constant of a weak monoprotic acid Chumami (Ao =…
A: The dissociation equilibrium for the weak monoprotic acid Chumami can be expressed as:…
Q: next question The following evidence was obtained during the titration of chromium (1) nitrate with…
A: Write the expression to find the unknown values from known values. M1V1=M2V2 where M1 and M2 are the…
Q: Nitrous acid-observation is gas bubbles Hinsberg test-obsersvation is one layer. THen acid is added…
A: Hinsberg test is a chemical tes used to distinguish between primary, secondary and tertiary amines.…
Q: Give six differences between tituration and levigation
A: Six differences between trituration and levigation- 1) Triturate is the continual rubbing of a solid…
Q: Iodometric titration of vitamic C with sodium thiosulfate Why was the known excess of iodine…
A: Ascorbic acid (vitamin C) is mainly found in fresh fruits such as lemon, orange, lime, peach,…
Q: Why is it necessary to completely fill the rubber tubing of the stopcock with the solution before…
A: Titrations are done by using a buret. A burette is the volumetric measuring glassware carries marks…
Q: Briefly explain why the sparingly soluble product mustbe removed by filtration before you…
A: In Volhard's determination of the ions, the sparingly soluble ions must be removed by filtration…
Q: A solution containing Mg2+ was buffered to pH 9.97 and titrated with EDTA. Eriochrome black T, with…
A: Eriochrome black T is a diprotic acid, represented as H2E.
Q: Using the experimental data at 1/2 the equivalence point volume, calculate the Ka of acetic acid.
A: When acetic acid reacts with NaOH, the following reaction occurs: CH3COOH+NaOH→CH3COONa+H2O
Q: Describe what is done in a displacement titration and give an example.
A: In displacement titration a complex is formed as analyte displaces a reagent, and amount of…
Q: What is/are the principle/s involved on ACIDIMETRIC ASSAY BY DOUBLE INDICATOR TITRATION?
A: Titration is a common laboratory method of quantitative chemical analysis to determine the…
Q: EDTA is a hexaprotic acid - it has 6 acidic hydrogens. EDTA has four carboxylic acid groups and two…
A: Given : EDTA is having total 6 acidic H and is having 2+ charge in total. Hence the EDTA can be…
Q: FeCl3 and MgCl2 solution was prepared by dissolving FeCl3 (AR) and MgCl2 (AR) in distilled water.…
A: Hydrolysis is a process in which the compound reacts with water. The required compound in this given…
Q: Why is the electrometric method of pH determination more accurate than the colorimetric method?
A: The Electrometric Method for assessing a solution's Hydrogen Ion Concentration, or pH value, entails…
Q: Why is Potassium Chromate used as the indicator in Mohr Method Determination of Chloride? Explain
A: Potassium Chromate used as the indicator in Mohr Method for determination of Chloride.
Q: Ff a solid, unknown acid were contaminated with pure, absorbed water prior to weighing out the…
A: The molar mass explains the relation between individual atoms and large samples. The molar mass of…
Q: How will the reported solubility product of borax be affected if some of the solid borax is…
A: Given that some of the solid borax is inadvertently transferred into the Erlenmeyer flask and…
Q: Why is Bromocresol green used for the base unknown while phenolphthalein is used for the acid…
A: Phenolphthalein is a colourless, weak acid which dissociates in water forming pink anions. The Pka…
Q: Draw a titration curve for the tetrapeptide Trp-Asp-Lys-Gly. Label all pK,s, the pl and the net…
A: Trp-Asp-Lys-Gly
Q: How would the calculated molar concentration of the analyte be affected if the burette is rinsed…
A: In laboratory while we use burette for titration,we should always rinse it with water at first and…
Q: the percentage of sodium bicarbonate in the sample
A:
Q: studont performed a titration to detormine the cxact concentracion of NaOHlani. Thec thration was…
A: In order to find the 95% confidence interval, we have to calculate the standard deviation using an…
Q: NazB4O, Borax Dissociation of Salt: NIE of Hydrolysis: (Use your experimental data to help you with…
A: Na2B4O7 (aq) → 2 Na+ (aq) + B4O72- If aqueous solution of borax dissociates it gives rise to…
Q: Given the chemical equation for the anthocyanin extract of red cabbage as an indicator. HIn + H2O ⇌…
A: An indicator is a substance that tells you how acidic or basic a solution is. These are mainly weak…
Q: A suitable target for the titration is 30.0 cm3 of 0.025 moldm-3 Br2(aq) Justify why a much smaller…
A:
Q: Kb for methylamine at 25°C is 4.4 x 10⁻⁴ what is its pH if 0.10M solution is used.
A:
Q: A student recorded the following end-point volumes in an iodometric titration using starch…
A: Titration error is -3.89 x 10⁻⁴ .
Q: Calculate the value of Q if mixture contains 0.21 M SO,, 0.19 M 02, and 0.42 M SO,
A: The reaction is: 2SO2 + O2 -----> 2SO3 [SO3]= 0.42 M [SO2] = 0.21 M [O2] = 0.19 M
Q: When one would like to run an experiment with EDTA, sometimes it is necessary to do back titration.…
A: Sometimes when performing EDTA titration the metal ions block the indicator or metal EDTA complex…
Q: If all the N in 10.0 mmols urea, CO(NH2)2, is converted to NH4HSO4, and if, with excess NaOH, the…
A: MilliMoles of urea = 10 mmol 1 mole of urea = 2 moles of nitrogen 10 mmol of urea =(2 ×10) mmoles of…
Q: A chemist titrates 140.0 ml. of a 0.8580M trimethylamine ((CH,),N) solution with 0.8956M HNO,…
A: Given that : Molarity of trimethylamine(M1) = 0.8580 M Volume of trimethylamine(V1) = 140 mL…
Q: 2. What is the physical observation when the endpoint has been achieved during titration?
A: Endpoint: refers to the point at which the indicator changes color in an acid-base titration.
Q: The indicator phenolphthalein may be regarded as a weak monobasic acid. Explain briefly why the…
A: Monobasic acid: The acid which gives one H+ ion in the solution. While the indicator is a substance…
Q: Why should be solution of sodium bicarbonate be boiled during titration with HCI?
A:
Q: As a chemist, you know that when analyzing a 50-ml sample for total hardness, every milliliter (1.00…
A: General chemistry
Q: Q1 (a) Consider following sentences as true or false. Briefly justify the answer. Acetic acid is a…
A: Acidic strength is a measure of ka value. Aromatics compound burns with sooty flame. Normality,…
Q: The standardization of same titrant during the determination of BOD5 of water sample was done…
A: When standard sodium thiosulphate is prepared it is standardized with primary titrant like potassium…
Q: Derive the ionization fraction, a2, where (HPO?-), in terms of and the acidity constants, Ka1, Kaz,…
A:
Q: Which is the limiting factor if we have: 0.015 moles of sulfunilic acid 0.010 moles of sodium…
A: Limiting substance is that substance that reacts completely in the reaction. In the above reaction…
Q: This problem uses a bicarbonate/carbonate buffer which means that we can consider the following…
A: The Ka for bicarbonate is 4.7 x 10⁻¹¹ is correct. Since pKa = -log(Ka) Hence substituting the…
V2


Trending now
This is a popular solution!

Step by step
Solved in 4 steps with 3 images

- A newly synthesized drug was found to have a carboxyl group, an imide and a sulfonamide group. The first type of method to consider in this drug molecule’s quantitatve analysis is: a. Non-aqueous Alkalimetryb. Non-aqueous Acidimetryc. Aqueous Alklaimetryd. Aqueous AcidimetryAn impure sample containing carbonate and sodium bicarbonate, weighing 0.5 g, was taken. It was dissolved in distilled water and then flushed with 0.1 N hydrochloric acid. If the burette reading at the end point of the phenolphthalein index is 10.5 milliliters, and at the orange methyl index end point it is equal to 30.1 milliliters. So, the percentage of sodium bicarbonate in the sample is ............., knowing that the molecular weight of sodium bicarbonate is 84 g/mol.State and describe any instrument that you will use to separate components in a mixture of amino acids containing histidine, lysine and cystein.
- 3. The conductivity of a 0.05M solution of acetic acid at 18°C is 4.4 × 10⁻⁴ Ω-1cm-1. Λ° of acetic acid at the same temperature is 387 Ω-1cm2. Calculate the dissociation constant (Ka) of acetic acid?Give detailed Solution with explanation needed of both sub parts..don't give Handwritten answer..don't use Ai for answering thisGive detailed Solution..no need handwritten answer