The accompanying table shows eleven altitudes (in thousands of feet) and the speeds of sound (in feet per second) at these altitudes. Co Click here to view the data table, Click here to view the table of critical values for the Pearson correlation coefficient. Altitude, x Speed of sound, y a StatCrunch ...... 1115,8 (b) Calculate the sample correlation coefficient r. 1097.9 10 1075.9 15 1056.2 (Round to three decimal places as needed.) 1036.9 20 (c) Describe the type of correlation, if any, and interpret the correlation in the context of the data. 25 1014.7 30 996.5 There is linear correlation. 35 969.5 40 967.9 Interpret the correlation. Choose the correct answer below. 967.9 45 50 967.9 O A. As altitude increases, speeds of sound tend to decrease. O B. Based on the correlation, there does not appear to be a linear relationship between altitude and speed of sound. OC. Higher altitudes cause increases in speeds of sound. rint Done O D. As altitude increases, speeds of sound tend to increase. O E. Higher altitudes cause decreases in speeds of sound. there is a significant linear correlation OF. Based on the correlation, there does not appear to be any relationship between altitude and speed of sound. there is no correlation (d) Use the table of critical values for the Pearson correlation coefficient to make a conclusion about the correlation c between altitude and speed of sound. V sufficient evidence at the 1% level of significance to conclude that The critical value is. Therefore, there (Round to three decimal nlaces as needed)
The accompanying table shows eleven altitudes (in thousands of feet) and the speeds of sound (in feet per second) at these altitudes. Co Click here to view the data table, Click here to view the table of critical values for the Pearson correlation coefficient. Altitude, x Speed of sound, y a StatCrunch ...... 1115,8 (b) Calculate the sample correlation coefficient r. 1097.9 10 1075.9 15 1056.2 (Round to three decimal places as needed.) 1036.9 20 (c) Describe the type of correlation, if any, and interpret the correlation in the context of the data. 25 1014.7 30 996.5 There is linear correlation. 35 969.5 40 967.9 Interpret the correlation. Choose the correct answer below. 967.9 45 50 967.9 O A. As altitude increases, speeds of sound tend to decrease. O B. Based on the correlation, there does not appear to be a linear relationship between altitude and speed of sound. OC. Higher altitudes cause increases in speeds of sound. rint Done O D. As altitude increases, speeds of sound tend to increase. O E. Higher altitudes cause decreases in speeds of sound. there is a significant linear correlation OF. Based on the correlation, there does not appear to be any relationship between altitude and speed of sound. there is no correlation (d) Use the table of critical values for the Pearson correlation coefficient to make a conclusion about the correlation c between altitude and speed of sound. V sufficient evidence at the 1% level of significance to conclude that The critical value is. Therefore, there (Round to three decimal nlaces as needed)

Glencoe Algebra 1, Student Edition, 9780079039897, 0079039898, 2018
18th Edition
ISBN:9780079039897
Author:Carter
Publisher:Carter
Chapter10: Statistics
Section10.4: Distributions Of Data
Problem 19PFA

Related questions
Question
Answer these questions
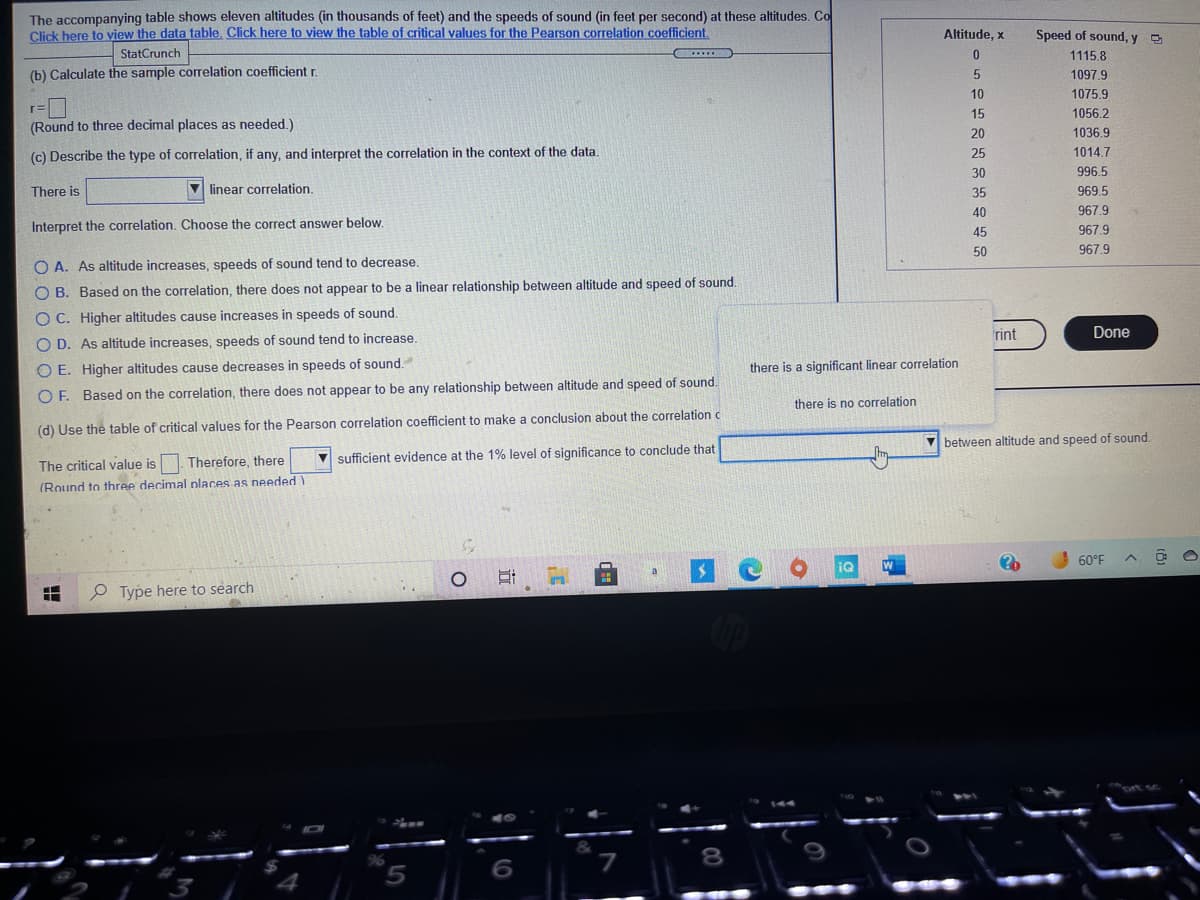
Transcribed Image Text:The accompanying table shows eleven altitudes (in thousands of feet) and the speeds of sound (in feet per second) at these altitudes. Co
Click here to view the data table, Click here to view the table of critical values for the Pearson correlation coefficient.
Altitude, x
Speed of sound, y
StatCrunch
...
1115.8
(b) Calculate the sample corelation coefficient r.
1097.9
10
1075.9
r=
(Round to three decimal places as needed.)
15
1056.2
20
1036.9
(c) Describe the type of correlation, if any, and interpret the correlation in the context of the data.
25
1014.7
30
996.5
There is
V linear correlation.
35
969.5
40
967.9
Interpret the correlation. Choose the correct answer below.
967.9
45
50
967.9
O A. As altitude increases, speeds of sound tend to decrease.
O B. Based on the correlation, there does not appear to be a linear relationship between altitude and speed of sound.
O C. Higher altitudes cause increases in speeds of sound.
rint
Done
O D. As altitude increases, speeds of sound tend to increase.
O E. Higher altitudes cause decreases in speeds of sound.
there is a significant linear correlation
O F. Based on the correlation, there does not appear to be any relationship between altitude and speed of sound.
there is no correlation
(d) Use the table of critical values for the Pearson correlation coefficient to make a conclusion about the correlation c
V between altitude and speed of sound.
V sufficient evidence at the 1% level of significance to conclude that
The critical value is1. Therefore, there
(Round to three decimal nlaces as needed )
60°F
P Type here to search
8
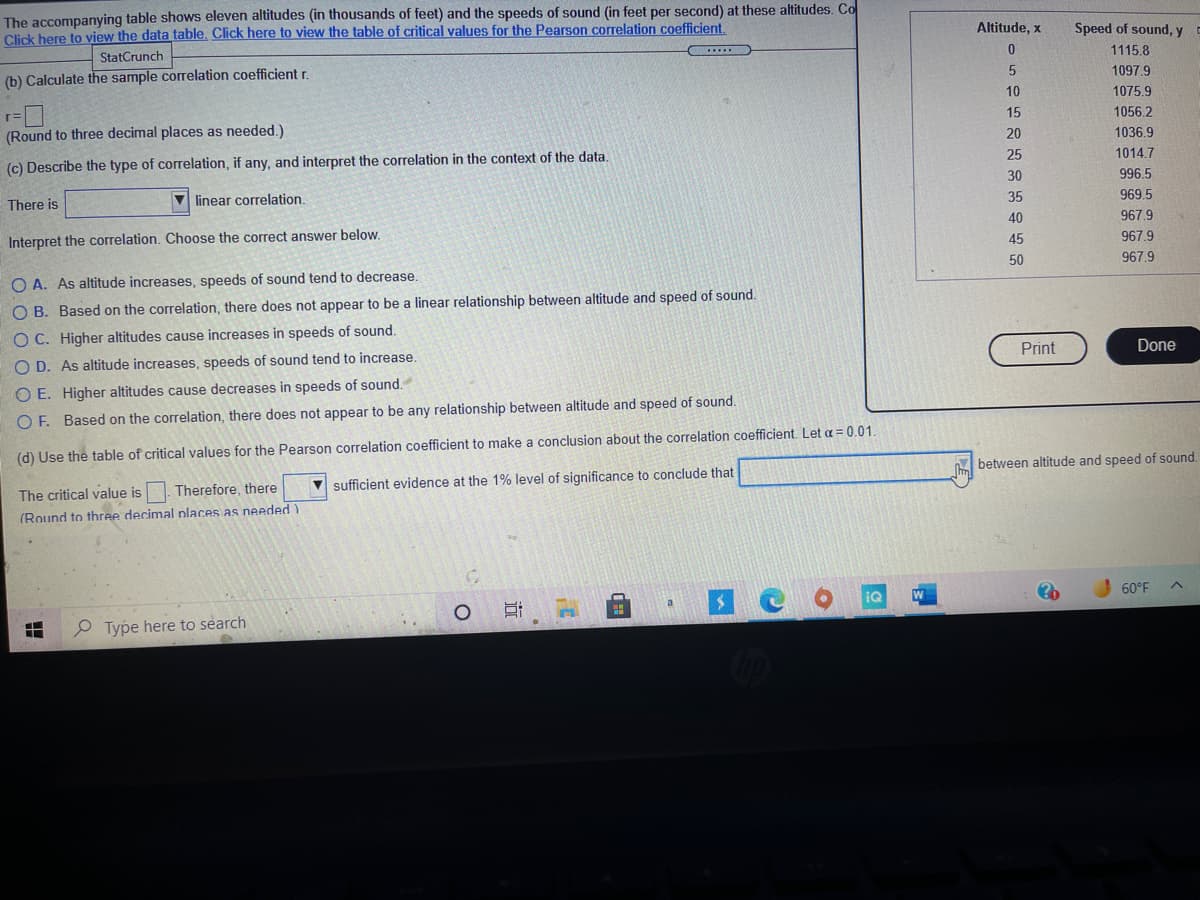
Transcribed Image Text:The accompanying table shows eleven altitudes (in thousands of feet) and the speeds of sound (in feet per second) at these altitudes. Co
Click here to view the data table. Click here to view the table of critical values for the Pearson correlation coefficient.
Altitude, x
Speed of sound, y
StatCrunch
1115.8
(b) Calculate the sample correlation coefficient r.
1097.9
10
1075.9
(Round to three decimal places as needed.)
15
1056.2
20
1036.9
(c) Describe the type of correlation, if any, and interpret the correlation in the context of the data.
25
1014.7
30
996.5
There is
V linear correlation.
35
969.5
40
967.9
Interpret the correlation. Choose the correct answer below.
45
967.9
50
967.9
O A. As altitude increases, speeds of sound tend to decrease.
O B. Based on the correlation, there does not appear to be a linear relationship between altitude and speed of sound.
O C. Higher altitudes cause increases in speeds of sound.
O D. As altitude increases, speeds of sound tend to increase.
Print
Done
O E. Higher altitudes cause decreases in speeds of sound.
O F. Based on the correlation, there does not appear to be any relationship between altitude and speed of sound.
(d) Use the table of critical values for the Pearson correlation coefficient to make a conclusion about the correlation coefficient. Let a = 0.01.
A between altitude and speed of sound.
The critical value is
Therefore, there
V sufficient evidence at the 1% level of significance to conclude that
(Round to three decimal places as needed)
IQ
60°F
P Type here to search
Expert Solution
This question has been solved!
Explore an expertly crafted, step-by-step solution for a thorough understanding of key concepts.

This is a popular solution!

Trending now
This is a popular solution!

Step by step
Solved in 3 steps with 3 images

Recommended textbooks for you
Glencoe Algebra 1, Student Edition, 9780079039897…
Algebra
ISBN:
9780079039897
Author:
Carter
Publisher:
McGraw Hill
Glencoe Algebra 1, Student Edition, 9780079039897…
Algebra
ISBN:
9780079039897
Author:
Carter
Publisher:
McGraw Hill