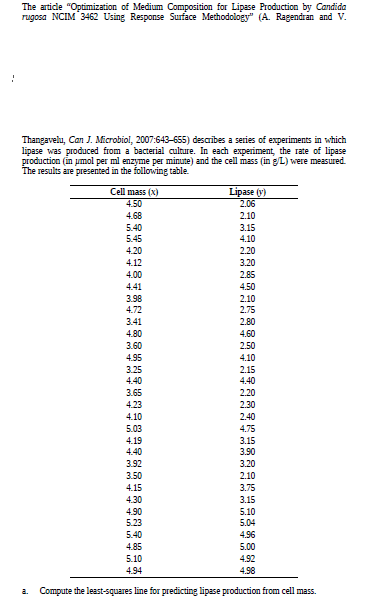
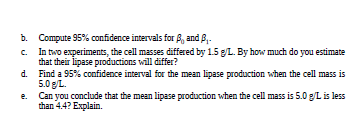
The article "Optimization of Medium Composition for Lipase Production by Candida rugosa NCIM 3462 Using Response Surface Methodology" (A. Ragendran and V. Thangavelu, Can J. Microbiol, 2007:643-655) describes a series of experiments in which lipase was produced from a bacterial culture. In each experiment, the rate of lipase production (in umol per ml enzyme per minute) and the cell mass (in g/L) were measured. The results are presented in the following table. Cell mass (x) Lipase (y) 4.50 2.06 4.68 2.10 5.40 3.15 5.45 4.10 4.20 2.20 4.12 3.20 4.00 2.85 4.50 2.10 4.41 3.98 4.72 2.75 3.41 2.80 4.80 4.60 3.60 2.50 4.95 4.10 3.25 2.15 4.40 4.40 3.65 2.20 4.23 2.30 4.10 2.40 5.03 4.75 3.15 3.90 4.19 4.40 3.92 3.20 3.50 2.10 4.15 3.75 4.30 3.15 4.90 5.10 5.23 5.04 5.40 4.96 4.85 5.00 5.10 4.92 4.94 4.98 a. Compute the least-squares line for predicting lipase production from cell mass. Compute 95% confidence intervals for B, and B,- c. In two experiments, the cell masses differed by 1.5 g/L. By how much do you estimate that their lipase productions will differ? d. Find a 95% confidence interval for the mean lipase production when the cell mass is 5.0 g/L. Can you conclude that the mean lipase production when the cell mass is 5.0 g/L is less than 4.4? Explain.
The article "Optimization of Medium Composition for Lipase Production by Candida rugosa NCIM 3462 Using Response Surface Methodology" (A. Ragendran and V. Thangavelu, Can J. Microbiol, 2007:643-655) describes a series of experiments in which lipase was produced from a bacterial culture. In each experiment, the rate of lipase production (in umol per ml enzyme per minute) and the cell mass (in g/L) were measured. The results are presented in the following table. Cell mass (x) Lipase (y) 4.50 2.06 4.68 2.10 5.40 3.15 5.45 4.10 4.20 2.20 4.12 3.20 4.00 2.85 4.50 2.10 4.41 3.98 4.72 2.75 3.41 2.80 4.80 4.60 3.60 2.50 4.95 4.10 3.25 2.15 4.40 4.40 3.65 2.20 4.23 2.30 4.10 2.40 5.03 4.75 3.15 3.90 4.19 4.40 3.92 3.20 3.50 2.10 4.15 3.75 4.30 3.15 4.90 5.10 5.23 5.04 5.40 4.96 4.85 5.00 5.10 4.92 4.94 4.98 a. Compute the least-squares line for predicting lipase production from cell mass. Compute 95% confidence intervals for B, and B,- c. In two experiments, the cell masses differed by 1.5 g/L. By how much do you estimate that their lipase productions will differ? d. Find a 95% confidence interval for the mean lipase production when the cell mass is 5.0 g/L. Can you conclude that the mean lipase production when the cell mass is 5.0 g/L is less than 4.4? Explain.

MATLAB: An Introduction with Applications
6th Edition
ISBN:9781119256830
Author:Amos Gilat
Publisher:Amos Gilat
Chapter1: Starting With Matlab
Section: Chapter Questions
Problem 1P

Related questions
Question
Transcribed Image Text:The article "Optimization of Medium Composition for Lipase Production by Candida
rugosa NCIM 3462 Using Response Surface Methodology" (A. Ragendran and V.
Thangavelu, Can J. Microbiol, 2007:643-655) describes a series of experiments in which
lipase was produced from a bacterial culture. In each experiment, the rate of lipase
production (in umol per ml enzyme per minute) and the cell mass (in g/L) were measured.
The results are presented in the following table.
Cell mass (x)
Lipase (y)
4.50
2.06
4.68
2.10
5.40
3.15
5.45
4.10
4.20
2.20
4.12
3.20
4.00
2.85
4.50
2.10
4.41
3.98
4.72
2.75
3.41
2.80
4.80
4.60
3.60
2.50
4.95
4.10
3.25
2.15
4.40
4.40
3.65
2.20
4.23
2.30
4.10
2.40
5.03
4.75
3.15
3.90
4.19
4.40
3.92
3.20
3.50
2.10
4.15
3.75
4.30
3.15
4.90
5.10
5.23
5.04
5.40
4.96
4.85
5.00
5.10
4.92
4.94
4.98
a.
Compute the least-squares line for predicting lipase production from cell mass.
Transcribed Image Text:Compute 95% confidence intervals for B, and B,-
c. In two experiments, the cell masses differed by 1.5 g/L. By how much do you estimate
that their lipase productions will differ?
d. Find a 95% confidence interval for the mean lipase production when the cell mass is
5.0 g/L.
Can you conclude that the mean lipase production when the cell mass is 5.0 g/L is less
than 4.4? Explain.
Expert Solution
This question has been solved!
Explore an expertly crafted, step-by-step solution for a thorough understanding of key concepts.

This is a popular solution!

Trending now
This is a popular solution!

Step by step
Solved in 3 steps with 3 images

Recommended textbooks for you
MATLAB: An Introduction with Applications
Statistics
ISBN:
9781119256830
Author:
Amos Gilat
Publisher:
John Wiley & Sons Inc

Probability and Statistics for Engineering and th…
Statistics
ISBN:
9781305251809
Author:
Jay L. Devore
Publisher:
Cengage Learning

Statistics for The Behavioral Sciences (MindTap C…
Statistics
ISBN:
9781305504912
Author:
Frederick J Gravetter, Larry B. Wallnau
Publisher:
Cengage Learning
MATLAB: An Introduction with Applications
Statistics
ISBN:
9781119256830
Author:
Amos Gilat
Publisher:
John Wiley & Sons Inc
Probability and Statistics for Engineering and th…
Statistics
ISBN:
9781305251809
Author:
Jay L. Devore
Publisher:
Cengage Learning
Statistics for The Behavioral Sciences (MindTap C…
Statistics
ISBN:
9781305504912
Author:
Frederick J Gravetter, Larry B. Wallnau
Publisher:
Cengage Learning

Elementary Statistics: Picturing the World (7th E…
Statistics
ISBN:
9780134683416
Author:
Ron Larson, Betsy Farber
Publisher:
PEARSON

The Basic Practice of Statistics
Statistics
ISBN:
9781319042578
Author:
David S. Moore, William I. Notz, Michael A. Fligner
Publisher:
W. H. Freeman

Introduction to the Practice of Statistics
Statistics
ISBN:
9781319013387
Author:
David S. Moore, George P. McCabe, Bruce A. Craig
Publisher:
W. H. Freeman