The article "Variance Reduction Techniques: Experimental Comparison and Analysis for Single Systems" (I. Sabuncuoglu, M. Fadiloglu, and S. Çelik, IIE Transactions, 2008:538- 551) describes a study of methods for reducing variance in estimators of the mean inventory on hand. Two systems, the serial line system and the inventory system, were studied, along with two schemes for proportional sampling. The results given below (in percent) are consistent with the means and standard deviations reported in the article. System Serial Scheme Reduction A 6.4 5.8 5.1 8.4 7.0 8.4 8.5 7.5 7.0 7.9 Line Serial 4.7 4.7 3.8 5.3 10.6 4.5 8.2 10.8 5.1 5.7 Line Inventory Inventory A. 11.0 8.9 9.3 9.2 7.9 9.7 9.0 12.5 6.7 9.8 8.9 7.0 10.7 10.3 6.2 12.2 7.0 9.5 8.7 9.7 a. Estimate all main effects and interactions. b. Construct an ANOVA table. You may give ranges for the P-values. Is the additive model plausible? Provide the value of a test statistic and the P-value. d. Can the effect of system on reduction be described by interpreting the main effects of system? If so, interpret the main effects, including the appropriate test statistic and P- value. If not, explain why not. Can the effect of scheme on reduction be described by interpreting the main effects of scheme? If so, interpret the main effects, including the appropriate test statistic and P- value. If not, explain why not. C. e.
The article "Variance Reduction Techniques: Experimental Comparison and Analysis for Single Systems" (I. Sabuncuoglu, M. Fadiloglu, and S. Çelik, IIE Transactions, 2008:538- 551) describes a study of methods for reducing variance in estimators of the mean inventory on hand. Two systems, the serial line system and the inventory system, were studied, along with two schemes for proportional sampling. The results given below (in percent) are consistent with the means and standard deviations reported in the article. System Serial Scheme Reduction A 6.4 5.8 5.1 8.4 7.0 8.4 8.5 7.5 7.0 7.9 Line Serial 4.7 4.7 3.8 5.3 10.6 4.5 8.2 10.8 5.1 5.7 Line Inventory Inventory A. 11.0 8.9 9.3 9.2 7.9 9.7 9.0 12.5 6.7 9.8 8.9 7.0 10.7 10.3 6.2 12.2 7.0 9.5 8.7 9.7 a. Estimate all main effects and interactions. b. Construct an ANOVA table. You may give ranges for the P-values. Is the additive model plausible? Provide the value of a test statistic and the P-value. d. Can the effect of system on reduction be described by interpreting the main effects of system? If so, interpret the main effects, including the appropriate test statistic and P- value. If not, explain why not. Can the effect of scheme on reduction be described by interpreting the main effects of scheme? If so, interpret the main effects, including the appropriate test statistic and P- value. If not, explain why not. C. e.

Holt Mcdougal Larson Pre-algebra: Student Edition 2012
1st Edition
ISBN:9780547587776
Author:HOLT MCDOUGAL
Publisher:HOLT MCDOUGAL
Chapter11: Data Analysis And Probability
Section11.4: Collecting Data
Problem 2E

Related questions
Question
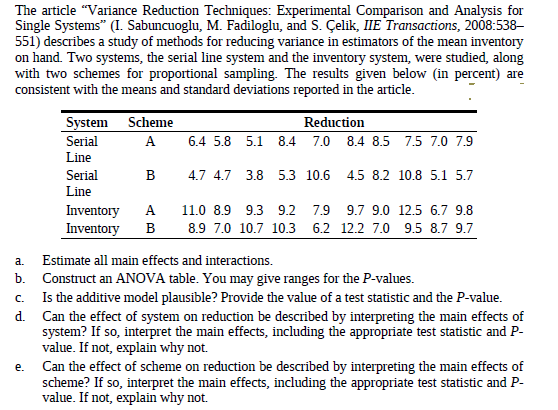
Transcribed Image Text:The article "Variance Reduction Techniques: Experimental Comparison and Analysis for
Single Systems" (I. Sabuncuoglu, M. Fadiloglu, and S. Çelik, IIE Transactions, 2008:538-
551) describes a study of methods for reducing variance in estimators of the mean inventory
on hand. Two systems, the serial line system and the inventory system, were studied, along
with two schemes for proportional sampling. The results given below (in percent) are
consistent with the means and standard deviations reported in the article.
System
Serial
Scheme
Reduction
A
6.4 5.8 5.1 8.4 7.0 8.4 8.5 7.5 7.0 7.9
Line
Serial
4.7 4.7 3.8 5.3 10.6 4.5 8.2 10.8 5.1 5.7
Line
Inventory
Inventory
A.
11.0 8.9 9.3 9.2 7.9 9.7 9.0 12.5 6.7 9.8
8.9 7.0 10.7 10.3 6.2 12.2 7.0 9.5 8.7 9.7
a.
Estimate all main effects and interactions.
b. Construct an ANOVA table. You may give ranges for the P-values.
Is the additive model plausible? Provide the value of a test statistic and the P-value.
d. Can the effect of system on reduction be described by interpreting the main effects of
system? If so, interpret the main effects, including the appropriate test statistic and P-
value. If not, explain why not.
Can the effect of scheme on reduction be described by interpreting the main effects of
scheme? If so, interpret the main effects, including the appropriate test statistic and P-
value. If not, explain why not.
C.
e.
Expert Solution
This question has been solved!
Explore an expertly crafted, step-by-step solution for a thorough understanding of key concepts.

This is a popular solution!

Trending now
This is a popular solution!

Step by step
Solved in 3 steps with 8 images

Recommended textbooks for you
Holt Mcdougal Larson Pre-algebra: Student Edition…
Algebra
ISBN:
9780547587776
Author:
HOLT MCDOUGAL
Publisher:
HOLT MCDOUGAL

Glencoe Algebra 1, Student Edition, 9780079039897…
Algebra
ISBN:
9780079039897
Author:
Carter
Publisher:
McGraw Hill

College Algebra (MindTap Course List)
Algebra
ISBN:
9781305652231
Author:
R. David Gustafson, Jeff Hughes
Publisher:
Cengage Learning
Holt Mcdougal Larson Pre-algebra: Student Edition…
Algebra
ISBN:
9780547587776
Author:
HOLT MCDOUGAL
Publisher:
HOLT MCDOUGAL
Glencoe Algebra 1, Student Edition, 9780079039897…
Algebra
ISBN:
9780079039897
Author:
Carter
Publisher:
McGraw Hill
College Algebra (MindTap Course List)
Algebra
ISBN:
9781305652231
Author:
R. David Gustafson, Jeff Hughes
Publisher:
Cengage Learning