The breaking strength of hockey stick shafts made of two different graphite-kevlar composites yields the following results (in Newtons): Composite 1: 469.2 493.3 468.2 497 506.2 512.2 483 481.5 484 469 481.3 491.3 477.1 (Note: The average and the standard deviation of the data are respectively 485.64 Newtons and 13.898 Newtons.) Composite 2: 450.4 474.1 455.8 431.1 442.4 460.6 465.8 428.3 433.8 472.5 465.6 46 466. 468.6 450 445.6 465.9 438.5 454.9 453 (Note: The average and the standard deviation of the data are respectively 454.36 Newtons and 14.028 Newtons.) Use a 1% significance level to test the claim that the standard deviation of the breaking strength of hockey stick shafts made of graphite-kevlar composite 1 is less than the standard deviation of the breaking strength of hockey stick shafts made of graphite-kevlar composite 2. If normality plots are not provided assume that the samples are from normal populations. Procedure: Select an answer Select an answer Assumption Two means T (pooled) Hypothesis Test Two means T (non-pooled) Hypothesis Test Inder Two variances F Hypothesis Test Simp Two means Z Hypothesis Test Two proportions Z Hypothesis Test Paire Two paired means T Hypothesis Test Normal populations Population standard deviations are known The number of positive and negative responses are both greater than 10 for both samples Population standard deviations are unknown but assumed equal Population standard deviation are unknown Sample rizer are both greater than 20
The breaking strength of hockey stick shafts made of two different graphite-kevlar composites yields the following results (in Newtons): Composite 1: 469.2 493.3 468.2 497 506.2 512.2 483 481.5 484 469 481.3 491.3 477.1 (Note: The average and the standard deviation of the data are respectively 485.64 Newtons and 13.898 Newtons.) Composite 2: 450.4 474.1 455.8 431.1 442.4 460.6 465.8 428.3 433.8 472.5 465.6 46 466. 468.6 450 445.6 465.9 438.5 454.9 453 (Note: The average and the standard deviation of the data are respectively 454.36 Newtons and 14.028 Newtons.) Use a 1% significance level to test the claim that the standard deviation of the breaking strength of hockey stick shafts made of graphite-kevlar composite 1 is less than the standard deviation of the breaking strength of hockey stick shafts made of graphite-kevlar composite 2. If normality plots are not provided assume that the samples are from normal populations. Procedure: Select an answer Select an answer Assumption Two means T (pooled) Hypothesis Test Two means T (non-pooled) Hypothesis Test Inder Two variances F Hypothesis Test Simp Two means Z Hypothesis Test Two proportions Z Hypothesis Test Paire Two paired means T Hypothesis Test Normal populations Population standard deviations are known The number of positive and negative responses are both greater than 10 for both samples Population standard deviations are unknown but assumed equal Population standard deviation are unknown Sample rizer are both greater than 20

MATLAB: An Introduction with Applications
6th Edition
ISBN:9781119256830
Author:Amos Gilat
Publisher:Amos Gilat
Chapter1: Starting With Matlab
Section: Chapter Questions
Problem 1P

Related questions
Question
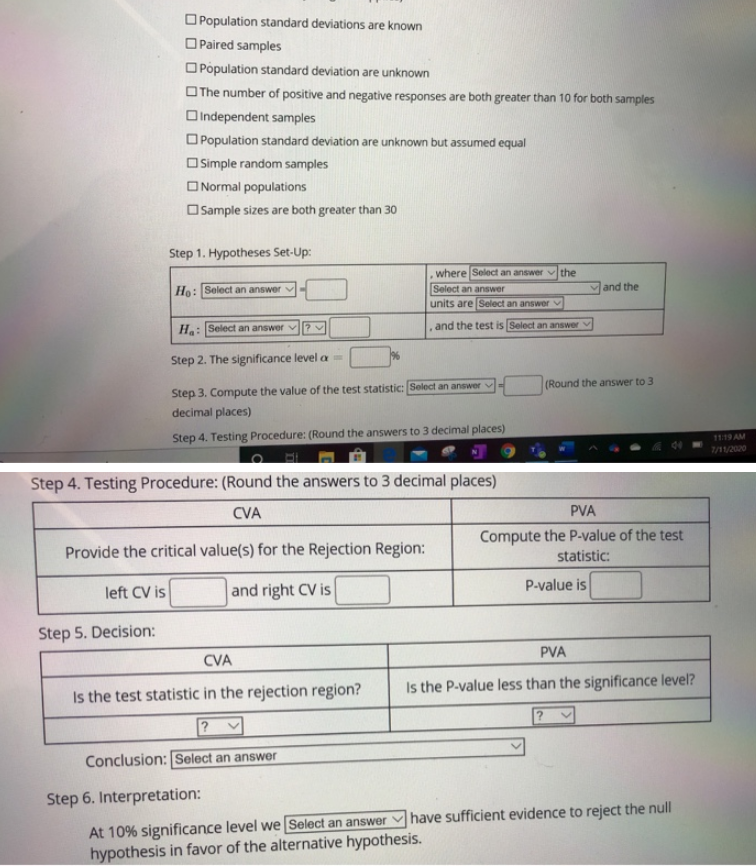
Transcribed Image Text:Population standard deviations are known
Paired samples
Population standard deviation are unknown
The number of positive and negative responses are both greater than 10 for both samples
Independent samples
Population standard deviation are unknown but assumed equal
Simple random samples
Normal populations
Sample sizes are both greater than 30
Step 1. Hypotheses Set-Up:
Ho: Select an answer
Ha: Select an answer?
Step 2. The significance level =
Step 3. Compute the value of the test statistic: Select an answer
decimal places)
Step 4. Testing Procedure: (Round the answers to 3 decimal places)
Step 4. Testing Procedure: (Round the answers to 3 decimal places)
CVA
Provide the critical value(s) for the Rejection Region:
left CV is
and right CV is
Step 5. Decision:
CVA
Is the test statistic in the rejection region?
Conclusion: Select an answer
where Select an answer the
Select an answer
units are Select an answer
, and the test is Select an answer V
Step 6. Interpretation:
At 10% significance level we [Select an answer
hypothesis in favor of the alternative hypothesis.
(Round the answer to 3
and the
PVA
Compute the P-value of the test
statistic:
P-value is
PVA
Is the P-value less than the significance level?
have sufficient evidence to reject the null
11:19 AM
7/11/2020
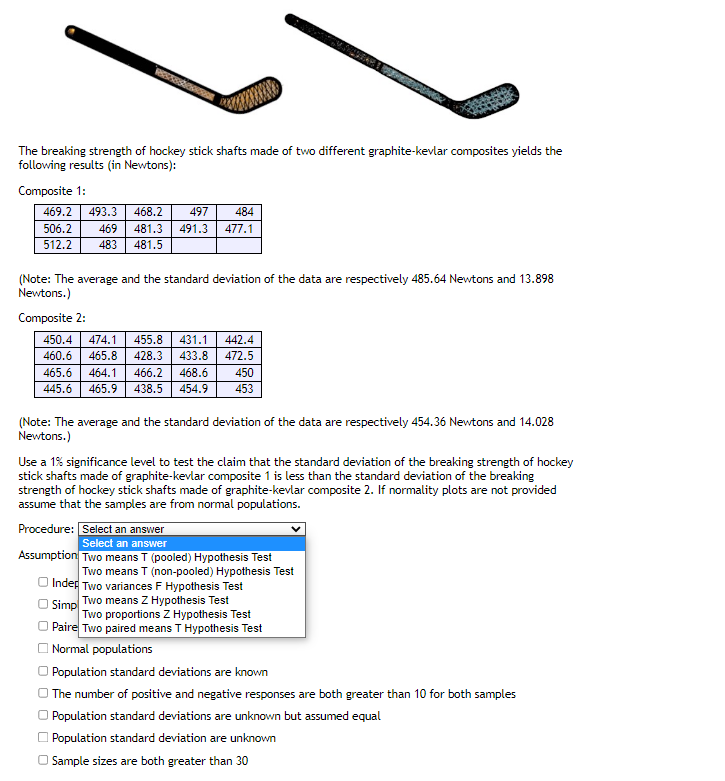
Transcribed Image Text:Reste
The breaking strength of hockey stick shafts made of two different graphite-kevlar composites yields the
following results (in Newtons):
Composite 1:
469.2 493.3 468.2 497
469
483 481.5
506.2
512.2
484
481.3 491.3 477.1
(Note: The average and the standard deviation of the data are respectively 485.64 Newtons and 13.898
Newtons.)
Composite 2:
450.4 474.1 455.8 431.1 442.4
460.6
465.8 428.3 433.8 472.5
465.6
445.6
464.1 466.2 468.6 450
465.9 438.5 454.9 453
(Note: The average and the standard deviation of the data are respectively 454.36 Newtons and 14.028
Newtons.)
Use a 1% significance level to test the claim that the standard deviation of the breaking strength of hockey
stick shafts made of graphite-kevlar composite 1 is less than the standard deviation of the breaking
strength of hockey stick shafts made of graphite-kevlar composite 2. If normality plots are not provided
assume that the samples are from normal populations.
Procedure: Select an answer
Select an answer
Assumption Two means T (pooled) Hypothesis Test
Two means T (non-pooled) Hypothesis Test
Inder Two variances F Hypothesis Test
Simp
Two means Z Hypothesis Test
Two proportions Z Hypothesis Test
Paire Two paired means T Hypothesis Test
Normal populations
Population standard deviations are known
The number of positive and negative responses are both greater than 10 for both samples
Population standard deviations are unknown but assumed equal
Population standard deviation are unknown
Sample sizes are both greater than 30
Expert Solution
This question has been solved!
Explore an expertly crafted, step-by-step solution for a thorough understanding of key concepts.

This is a popular solution!

Trending now
This is a popular solution!

Step by step
Solved in 2 steps with 2 images

Recommended textbooks for you
MATLAB: An Introduction with Applications
Statistics
ISBN:
9781119256830
Author:
Amos Gilat
Publisher:
John Wiley & Sons Inc

Probability and Statistics for Engineering and th…
Statistics
ISBN:
9781305251809
Author:
Jay L. Devore
Publisher:
Cengage Learning

Statistics for The Behavioral Sciences (MindTap C…
Statistics
ISBN:
9781305504912
Author:
Frederick J Gravetter, Larry B. Wallnau
Publisher:
Cengage Learning
MATLAB: An Introduction with Applications
Statistics
ISBN:
9781119256830
Author:
Amos Gilat
Publisher:
John Wiley & Sons Inc
Probability and Statistics for Engineering and th…
Statistics
ISBN:
9781305251809
Author:
Jay L. Devore
Publisher:
Cengage Learning
Statistics for The Behavioral Sciences (MindTap C…
Statistics
ISBN:
9781305504912
Author:
Frederick J Gravetter, Larry B. Wallnau
Publisher:
Cengage Learning

Elementary Statistics: Picturing the World (7th E…
Statistics
ISBN:
9780134683416
Author:
Ron Larson, Betsy Farber
Publisher:
PEARSON

The Basic Practice of Statistics
Statistics
ISBN:
9781319042578
Author:
David S. Moore, William I. Notz, Michael A. Fligner
Publisher:
W. H. Freeman

Introduction to the Practice of Statistics
Statistics
ISBN:
9781319013387
Author:
David S. Moore, George P. McCabe, Bruce A. Craig
Publisher:
W. H. Freeman