3 The heights in metres (x) and weights in kilograms (y) of ten male gorillas are shown in the table. 1.9 1.83 1.81 1.79 1.74 1.91 1.93 1.86 1.81 1.95 y 275 267 260 257 258 272 273 268 261 273 a Calculate the value of r. Comment on the correlation. b Write down the equation of the least squares regression line for this data. CFind the mean height for this group of male gorillas. d Find the mean weight for this group of male gorillas. e Plot the data points on a scatter diagram together with the regression line of y on x, clearly marking and labelling the mean point.
3 The heights in metres (x) and weights in kilograms (y) of ten male gorillas are shown in the table. 1.9 1.83 1.81 1.79 1.74 1.91 1.93 1.86 1.81 1.95 y 275 267 260 257 258 272 273 268 261 273 a Calculate the value of r. Comment on the correlation. b Write down the equation of the least squares regression line for this data. CFind the mean height for this group of male gorillas. d Find the mean weight for this group of male gorillas. e Plot the data points on a scatter diagram together with the regression line of y on x, clearly marking and labelling the mean point.

Glencoe Algebra 1, Student Edition, 9780079039897, 0079039898, 2018
18th Edition
ISBN:9780079039897
Author:Carter
Publisher:Carter
Chapter4: Equations Of Linear Functions
Section4.6: Regression And Median-fit Lines
Problem 1CYU

Related questions

Concept explainers
Contingency Table
A contingency table can be defined as the visual representation of the relationship between two or more categorical variables that can be evaluated and registered. It is a categorical version of the scatterplot, which is used to investigate the linear relationship between two variables. A contingency table is indeed a type of frequency distribution table that displays two variables at the same time.
Binomial Distribution
Binomial is an algebraic expression of the sum or the difference of two terms. Before knowing about binomial distribution, we must know about the binomial theorem.
Topic Video
Question
I need help with all of it please :)
Transcribed Image Text:MODELLING RELATIONSHIPS: LINEAR
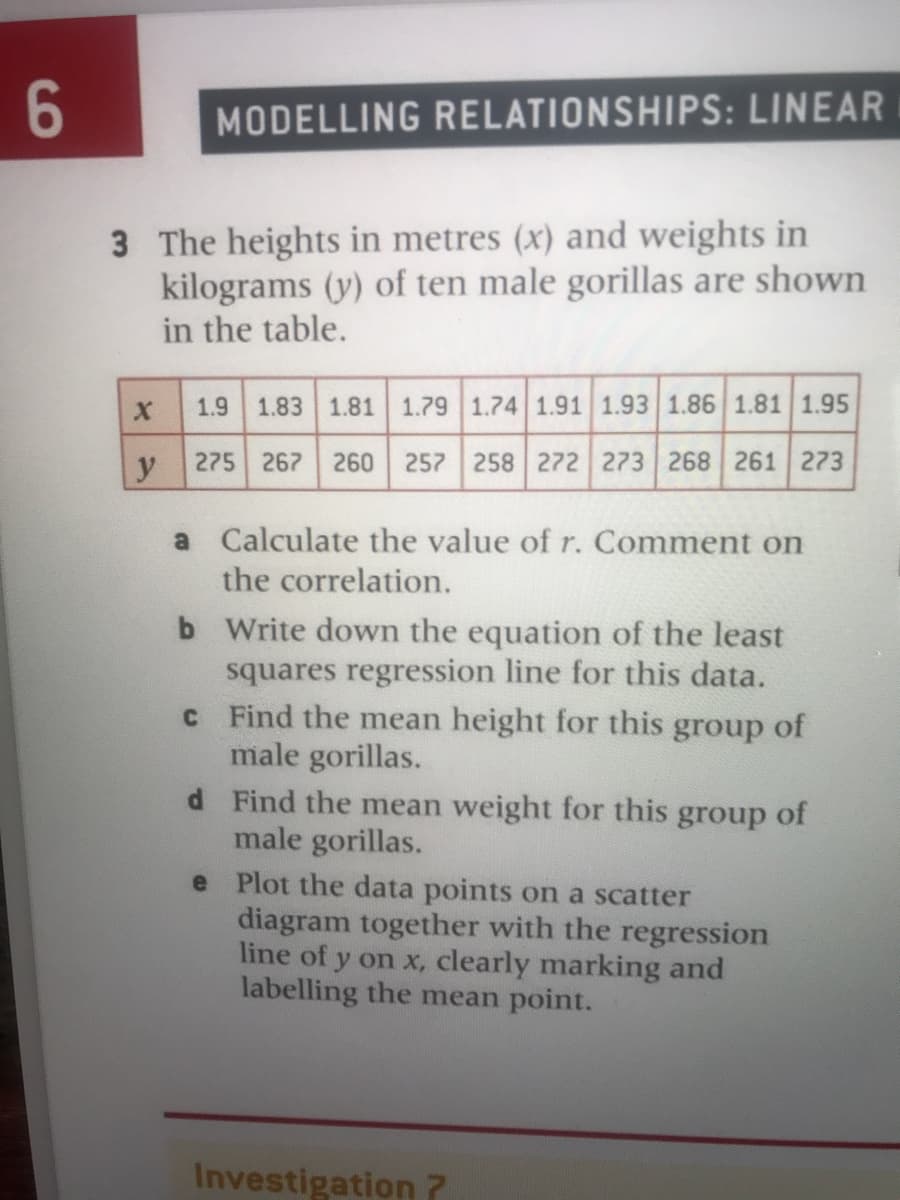
3 The heights in metres (x) and weights in
kilograms (y) of ten male gorillas are shown
in the table.
1.9
1.83 1.81
1.79 1.74 1.91 1.93 1.86 1.81 1.95
275 267
260
258 272 273 268 261 273
a Calculate the value of r. Comment on
the correlation.
b Write down the equation of the least
squares regression line for this data.
CF ind the mean height for this group of
male gorillas.
d Find the mean weight for this group of
male gorillas.
e Plot the data points on a scatter
diagram together with the regression
line of y on x, clearly marking and
labelling the mean point.
Investigation 7
Expert Solution
This question has been solved!
Explore an expertly crafted, step-by-step solution for a thorough understanding of key concepts.

This is a popular solution!

Trending now
This is a popular solution!

Step by step
Solved in 3 steps with 1 images

Knowledge Booster


Learn more about
Need a deep-dive on the concept behind this application? Look no further. Learn more about this topic, statistics and related others by exploring similar questions and additional content below.Recommended textbooks for you
Glencoe Algebra 1, Student Edition, 9780079039897…
Algebra
ISBN:
9780079039897
Author:
Carter
Publisher:
McGraw Hill

Big Ideas Math A Bridge To Success Algebra 1: Stu…
Algebra
ISBN:
9781680331141
Author:
HOUGHTON MIFFLIN HARCOURT
Publisher:
Houghton Mifflin Harcourt

Functions and Change: A Modeling Approach to Coll…
Algebra
ISBN:
9781337111348
Author:
Bruce Crauder, Benny Evans, Alan Noell
Publisher:
Cengage Learning
Glencoe Algebra 1, Student Edition, 9780079039897…
Algebra
ISBN:
9780079039897
Author:
Carter
Publisher:
McGraw Hill
Big Ideas Math A Bridge To Success Algebra 1: Stu…
Algebra
ISBN:
9781680331141
Author:
HOUGHTON MIFFLIN HARCOURT
Publisher:
Houghton Mifflin Harcourt
Functions and Change: A Modeling Approach to Coll…
Algebra
ISBN:
9781337111348
Author:
Bruce Crauder, Benny Evans, Alan Noell
Publisher:
Cengage Learning

College Algebra (MindTap Course List)
Algebra
ISBN:
9781305652231
Author:
R. David Gustafson, Jeff Hughes
Publisher:
Cengage Learning

Algebra and Trigonometry (MindTap Course List)
Algebra
ISBN:
9781305071742
Author:
James Stewart, Lothar Redlin, Saleem Watson
Publisher:
Cengage Learning

College Algebra
Algebra
ISBN:
9781305115545
Author:
James Stewart, Lothar Redlin, Saleem Watson
Publisher:
Cengage Learning