The data in the accompanying table represent the number of corn plants in randomly sampled rows (a 17-foot by 5-inch strip) for various types of plots. An agricultural researcher wants to know whether the mean numbers of plants for each plot type are equal. Complete parts (a) through (e) below. Click here to view the datatable Click here to view the table of critical values for the correlation coefficient. (a) Write the null and alternative hypotheses. Choose the correct answer below. O A. Hoi at least one of the means is different and H,: Haludoe = Hspring =Hno til O B. Ho: Hsludoe =Hsoring Hno i and H,: at least one of the means is different O C. Hg: Hsludoe Heoring and H,: the means are different OD. Ho: Haludoe =Hsoring =Hno a and H,: Hsludge
The data in the accompanying table represent the number of corn plants in randomly sampled rows (a 17-foot by 5-inch strip) for various types of plots. An agricultural researcher wants to know whether the mean numbers of plants for each plot type are equal. Complete parts (a) through (e) below. Click here to view the datatable Click here to view the table of critical values for the correlation coefficient. (a) Write the null and alternative hypotheses. Choose the correct answer below. O A. Hoi at least one of the means is different and H,: Haludoe = Hspring =Hno til O B. Ho: Hsludoe =Hsoring Hno i and H,: at least one of the means is different O C. Hg: Hsludoe Heoring and H,: the means are different OD. Ho: Haludoe =Hsoring =Hno a and H,: Hsludge

Glencoe Algebra 1, Student Edition, 9780079039897, 0079039898, 2018
18th Edition
ISBN:9780079039897
Author:Carter
Publisher:Carter
Chapter10: Statistics
Section10.3: Measures Of Spread
Problem 1GP

Related questions
Question
1:a. Need help with part a and b
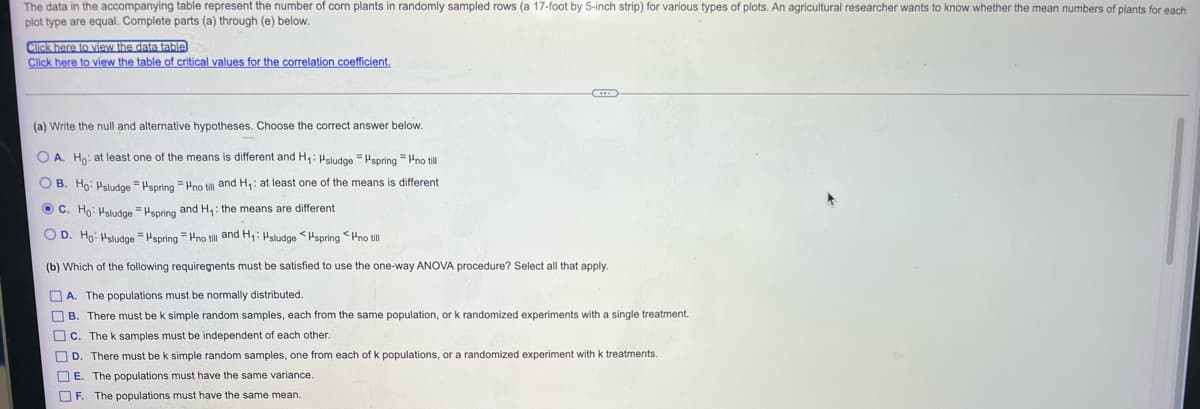
Transcribed Image Text:The data in the accompanying table represent the number of corn plants in randomly sampled rows (a 17-foot by 5-inch strip) for various types of plots. An agricultural researcher wants to know whether the mean numbers of plants for each
plot type are equal. Complete parts (a) through (e) below.
Click here to view the data table)
Click here to view the table of critical values for the correlation coefficient.
(a) Write the null and alternative hypotheses. Choose the correct answer below.
O A. Ho: at least one of the means is different and H,: Hsludge =Hspring = Pno till
O B. Ho: Hsludoe = Hspring= Pno till and H,: at least one of the means is different
O C. Ho: Hsludge = Hspring and H,: the means are different
O D. Ho: Hsludge = Hspring = Hno till and H,: Hsludge <Hspring <Hno till
(b) Which of the following requirements must be satisfied to use the one-way ANOVA procedure? Select all that apply.
O A. The populations must be normally distributed.
O B. There must be k simple random samples, each from the same population, or k randomized experiments with a single treatment.
Oc. The k samples must be independent of each other.
OD. There must be k simple random samples, one from each of k populations, or a randomized experiment with k treatments.
O E. The populations must have the same variance.
OF. The populations must have the same mean.
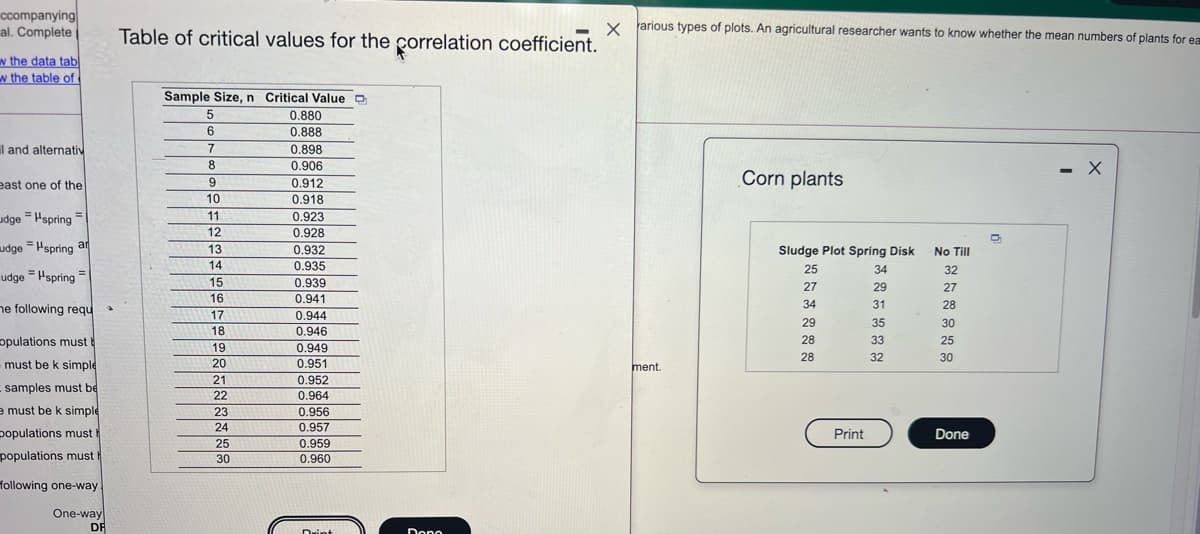
Transcribed Image Text:ccompanying
al. Complete
x farious types of plots. An agricultural researcher wants to know whether the mean numbers of plants for ea
Table of critical values for the correlation coefficient.
w the data tab
w the table of
Sample Size, n Critical Value
0.880
6.
0.888
l and alternativ
7
0.898
0.906
- X
east one of the
Corn plants
6.
0.912
10
0.918
0.923
0.928
0.932
udge = Hspring =
11
12
%3!
udge = Hspring ar
13
14
Sludge Plot Spring Disk
No Till
0.935
25
34
32
udge = Hspring =
15
0.939
27
29
27
16
0.941
34
31
28
ne following requ
17
0.944
0.946
29
35
30
18
opulations must b
28
33
25
19
0.949
28
32
30
must be k simple
20
0.951
ment.
21
0.952
samples must be
22
0.964
e must be k simple
23
0.956
24
0.957
populations must
Print
Done
25
0.959
populations must
30
0.960
following one-way
One-way
DE
Drint
Dono
Expert Solution
Step 1
For part a) of the question,
It is clearly mentioned in the question that the agricultural researcher wants to know whether the mean number of plants for each type of plots are equal or not .
So, clearly option B) will be the correct option
i.e. Ho: usludge =uspring=uno till and H1: atleast one of the means is different

Trending now
This is a popular solution!

Step by step
Solved in 2 steps

Recommended textbooks for you
Glencoe Algebra 1, Student Edition, 9780079039897…
Algebra
ISBN:
9780079039897
Author:
Carter
Publisher:
McGraw Hill
Glencoe Algebra 1, Student Edition, 9780079039897…
Algebra
ISBN:
9780079039897
Author:
Carter
Publisher:
McGraw Hill