The demand for a product of a company in each of the last twelve months is shown in the table below; Jan Feb Oct Nov Apr May Jun 50 Month Mar Jul Aug Sep Dec Jan Demand 37 40 41 37 45 43 47 56 52 55 54 Use the table to compute the following forecast demand for the company; a. Four months simple moving average b. Four months weighted moving average using the weight of 40%, 30% and 20% and 10%respectively.
The demand for a product of a company in each of the last twelve months is shown in the table below; Jan Feb Oct Nov Apr May Jun 50 Month Mar Jul Aug Sep Dec Jan Demand 37 40 41 37 45 43 47 56 52 55 54 Use the table to compute the following forecast demand for the company; a. Four months simple moving average b. Four months weighted moving average using the weight of 40%, 30% and 20% and 10%respectively.

Practical Management Science
6th Edition
ISBN:9781337406659
Author:WINSTON, Wayne L.
Publisher:WINSTON, Wayne L.
Chapter13: Regression And Forecasting Models
Section13.7: Exponential Smoothing Models
Problem 26P: The file P13_26.xlsx contains the monthly number of airline tickets sold by the CareFree Travel...

Related questions

Question
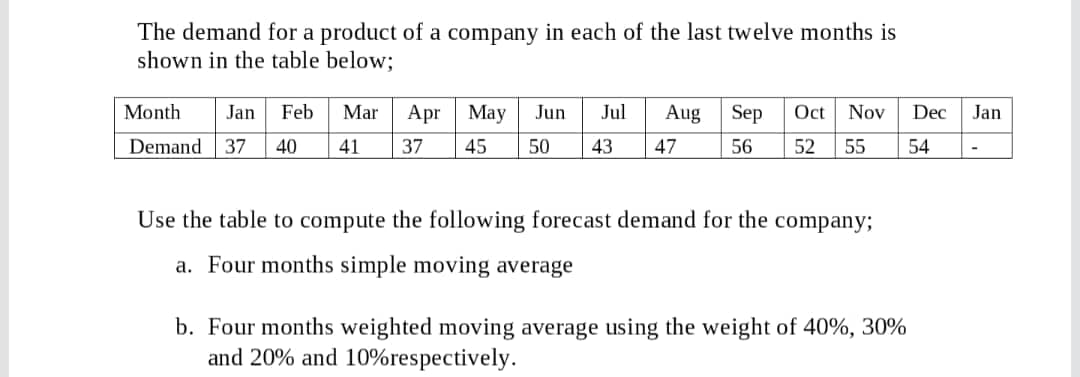
Transcribed Image Text:The demand for a product of a company in each of the last twelve months is
shown in the table below;
Month
Jan
Feb
Mar
Apr
May
Jun
Jul
Aug
Sep
Oct
Nov
Dec
Jan
Demand 37
40
41
37
45
50
43
47
56
52
55
54
Use the table to compute the following forecast demand for the company;
a. Four months simple moving average
b. Four months weighted moving average using the weight of 40%, 30%
and 20% and 10%respectively.
Expert Solution
This question has been solved!
Explore an expertly crafted, step-by-step solution for a thorough understanding of key concepts.

Step by step
Solved in 4 steps with 4 images

Knowledge Booster


Learn more about
Need a deep-dive on the concept behind this application? Look no further. Learn more about this topic, operations-management and related others by exploring similar questions and additional content below.Recommended textbooks for you
Practical Management Science
Operations Management
ISBN:
9781337406659
Author:
WINSTON, Wayne L.
Publisher:
Cengage,

Contemporary Marketing
Marketing
ISBN:
9780357033777
Author:
Louis E. Boone, David L. Kurtz
Publisher:
Cengage Learning

Marketing
Marketing
ISBN:
9780357033791
Author:
Pride, William M
Publisher:
South Western Educational Publishing
Practical Management Science
Operations Management
ISBN:
9781337406659
Author:
WINSTON, Wayne L.
Publisher:
Cengage,
Contemporary Marketing
Marketing
ISBN:
9780357033777
Author:
Louis E. Boone, David L. Kurtz
Publisher:
Cengage Learning
Marketing
Marketing
ISBN:
9780357033791
Author:
Pride, William M
Publisher:
South Western Educational Publishing

Purchasing and Supply Chain Management
Operations Management
ISBN:
9781285869681
Author:
Robert M. Monczka, Robert B. Handfield, Larry C. Giunipero, James L. Patterson
Publisher:
Cengage Learning