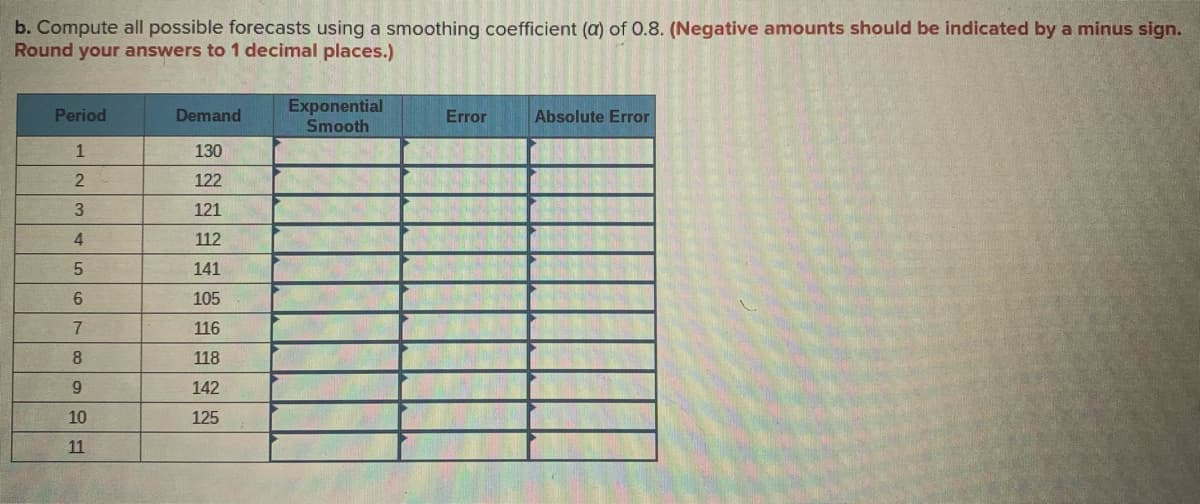
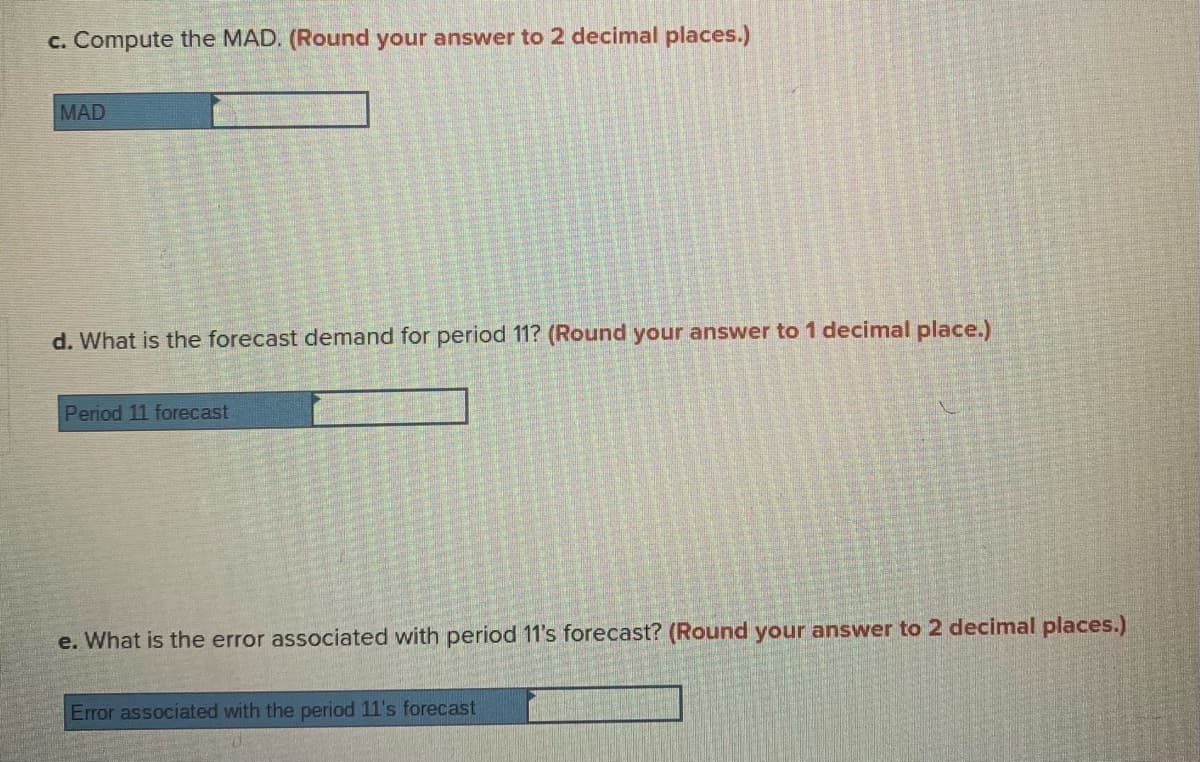
Using simple exponential smoothing and the following time series of data, respond to each of the items. Period. Demand 1. 130 2. 122 3. 121 4. 112 5. 141 6. 105 7. 166 8. 118 9. 142 10. 125


Q: With the gasoline time series data from the given table, show the exponential smoothing forecasts…
A:
Q: For the Hawkins Company, the monthly percentages of all shipments received on time over the past 12…
A: The Moving average forecast of order k is obtained by the formula- Ft+1=Ft+Ft-1+...+Ft-k+1k The…
Q: a) Suppose that a time series appears to exhibit a sudden major shift in pattern, how could you…
A: INTRODUCTION : the straight-line trend is given by the equation yt = a+bX the normal equations for…
Q: Using excel. For the Hawkins Company, the monthly percentages of all shipments received on time over…
A: a) The given information is that the monthly percentages of company Hawkin’s entire shipments of…
Q: (b) Use a = 0.4 to compute the exponential smoothing forecasts for the time series. (Round your…
A: We know that ; Formula for Exponential Smoothing Forecast = Ft+1=αYt + (1-α)Ft Given α=0.4 1] For…
Q: Apply the exponential smoothing technique with exponential smoothing constant a = 0.3 to the…
A:
Q: Given an actual demand of 69, a previous forecast of 64, and an alpha of .2, what would the forecast…
A: Given Actual demand=69 Previous forecast=64 Alpha=0.2
Q: The demand for a product for the last six years has been 15, 15, 17, 18, 20, and 19. The manager…
A: From the provided information, The simple linear trend equation is given as below:
Q: Using simple exponential smoothing and the following time series data, respond to each of the items.…
A: Given information: The data presents the values of demand for the period 1 through 14.
Q: (1) Four-month moving average; (2) Weighted three-month moving average using .50 for June, .30 for…
A: Time series is a stream of historical data. It is of 2 types- Stationary and Non-stationary. The…
Q: Q Monthly sales for a six month period are as follows: Month Sales Jan 18,000 Feb 22,000 16,000 Mar…
A: Given Information: Month Sales January 18000 February 22000 March 16000 April 18000 May…
Q: The life (years), of a battery is approximately exponentially distributed with decay parameter of…
A: Introduction: Denote the random variable X as the life (years) of a randomly selected battery.
Q: The sales trend has been modeled as: Sales-2°t+200, where te time in quarters, beginning in Q1 2010.…
A: Here, The formula for the quarters is 2*t+200, t is the time in quarters beginning Q1 of 2010.
Q: Compute the one-step-ahead 3-month and 6-month moving-average forecasts for July through December.…
A: Given information: The data presents the sample for the months January through December.
Q: Given is a historical time series for job services demand in the prior 6 months. Month Demand 1…
A:
Q: consider the following time series data.Month 1 2 3 4 5 6 7Value 24 13 20 12 19 23 15a. compute MSe…
A:
Q: The future value of an investment after t years is given by F(t) 140(1.126) thousand dollars. (a)…
A:
Q: Lenovo uses the ZX-81 chip in some of its laptop computers. The prices for the chip during the last…
A: The idea behind Exponential Smoothing for making forecasts consists of estimating the data value of…
Q: Using the information in the table below, find the occupancy rate for the years 2021 to 2024 using…
A: Given α=0.3. Let At represent the actual values of the occupancy rate and Ft represent the forecast…
Q: 5 Calanute Beach Resort, a fictional seaside luxury hotel | in Goa, India, had the following…
A:
Q: A certain company produces and sells frozen pizzas to public schools throughout the eastern United…
A: Given:The data is given.Year (x) :Indepenndent variableRevenue (y): Dependent variable
Q: In 2005, Xerox Corporation's revenue from color products and services was $4.6 billion, or 30%of…
A: Solution: This exponential smoothing is performed on Microsoft Excel. a) Step 1 : Open the…
Q: Using simple exponential smoothing and the following time series data, respond to each of the items.…
A: Given information: The data presents the values of demand for the period 1 through 10.
Q: Consider the following time series data. Week 1 2 3 4 5 6 Value 17 14 17 11 16 15 Develop a…
A: Using Excel, the three-week moving average is calculated as, Week Value 3-Week moving average…
Q: (b) Use a = 0.1 to compute the exponential smoothing values for the time series. (Round your answers…
A: Please find the answer in the excel sheet provided.
Q: Annual profit of a company (in million taka) are given below. Year 2010 2011 2012 2013 2014 2015…
A: Exponential smoothing forecast method is used to forecast the immediate future values. Exponential…
Q: Let's say you are playing the stock market and below period 2020 data was provided. For "stock A"…
A:
Q: Which one of the following statements about forecasting is FALSE? A. You should use the simple…
A:
Q: (c) Why is an assumption that the error term is uncorrelated with fu- ture values of explanatory…
A: c)Why is an assumption that error term is uncorrelated with future values of explanatory variables a…
Q: Use a smoothing constant of a = 0.4 to compute the exponential smoothing forecasts. (Round your…
A: Given information: The data presents the values of time series value for the months 1 through 12.
Q: Show the exponential smoothing forecasts using ? = 0.1. (Round your answers to three decimal…
A: Since you have posted a question with multiple sub-parts, we will solve the first three subparts for…
Q: The number of fishing rods selling each day isgiven below. Perform analyses of the time series to…
A: Here, is a time series data, and first we conduct a 3 period moving average on this data. Day…
Q: . At the Franklin Post Office, patrons wait in a singleline for the first open window. On average,…
A: Given: The average rate of the customers entering the system=100/ hr The service rate=45/hr…
Q: 2) Let y=505000e^−0.37t y= 505000e^-0.37t. When rewritten in the form y=abt y=abt, b =…
A:
Q: 7. The following table represents the new members that have been acquired by a fitness center. New…
A: Given, α = 0.3 and β = 0.4. The initial forecast is equal to 40. The trend adjusted exponential…
Q: Using simple exponential smoothing and the following time series data, respond to each of the items.…
A: “Since you have posted a question with multiple sub-parts, we will solve first three subparts for…
Q: A certain company produces and sells frozen pizzas to public schools throughout the eastern United…
A: a) Excel Procedure: Enter year and Revenue in Excel sheet>Select year and revenue>Insert…
Q: Let's say you are playing the stock market and below period 2020 data was provided. For "stock A"…
A:
Q: 0s15 20, where i is the number of years after the base year of 1905. 20. During the time period…
A:
Q: 5. Simple Exponential Smoothing with the following parameters: Ft+1=32 and the a = .15 6. Time…
A: Time series are used to forecast the variable based on the time. There are four components in the…
Q: The following table shows quarterly demand (in thousand units) for a product over 4 years. Year 1…
A: Since, the exact question number is not specified, we'll be answering the first question. Please…
Q: Let's say you are playing the stock market and below period 2020 data was provided. For "stock A"…
A: Given data is :
Q: Let's say you are playing the stock market and below period 2020 data was provided. For "stock A"…
A: Given :For stock B we can use exponential smoothing α=0.3
Q: (b) Develop a three-week moving average for this time series. Compute MSE and a forecast for week 7.…
A:
Q: With the gasoline time series data from table 17.1, show the exponential smoothing forecasts using a…
A: a.
Q: simple exponential smoothing and the following time series data, respond to each the items. Period.…
A: Given information: The data presents the values of demand for the period 1 through 10.
Q: A certain company produces and sells frozen pizzas to public schools throughout the eastern United…
A: Given: Year Revenue 1 8.43 2 10.84 3 12.88 4 14.21 5 16.41 6 17.21 7 18.27 8…
Q: Six years of quarterly data of a seasonally adjusted series are used to estimate a linear trend…
A: See the handwritten solution
Q: Consider the following time series data. Week 1 2 3 4 5 6 Value 19 14 16 11 17 15 Develop…
A: We have 6 week demand The three-week moving average forecasts for this time series is- Moving…


Trending now
This is a popular solution!

Step by step
Solved in 5 steps with 7 images


- a. In the Petroco Service Station problem, compute an exponentially smoothed forecast with an α value of .30. According to the result from Excel and/or POM-QM, the forecast for the month of August b.In the Petroco Service Station problem, for the exponentially smoothed forecast with an α value of .30, compute the mean absolute deviation (MAD) via Excel and/or POM-QM c. In the Petroco Service Station problem, compute an exponentially smoothed forecast with an α value of .50. According to the result from Excel and/or POM-QM, the forecast for the month of January would be d.In the Petroco Service Station problem, compute an exponentially smoothed forecast with an α value of .50. According to the result from Excel and/or POM-QM, the forecast for the month of AugustA researcher hypothesizes that in a certain country the net annual growth of private sector purchases of government bonds, B, is positively related to the nominal rate of interest on the bonds, NI, and negatively related to the rate of inflation Π: Bt = a0 + a1NIt + a2Π t + ut Note that it may be hypothesized that B depends on the real rate of interest on bonds, R, where R = NI – Π. Using a sample of 56 annual observations, s/he estimates the following equations: (1) Bt = 0.43 + 0.90NIt - 0.97Πt R21 = 0.962, SSR1 = 2.20, QRESET(F1,52) = 16.6 (3.58) (8.80) (-1.05) (2) Bt = 0.44 + 0.94Rt R22 = 0.960, SSR2 = 2.22, QRESET(F1,53) = 0.9 (9.70) (16.7) (3) Bt = 0.44 + 1.14NIt SSR3 = 9.20, QRESET(F1,53) = 59.9 (8.84) (36.1) (4) NIt = 0.08 + 0.94Πt R24 = 0.997, SSR4 = 0.18, QRESET(F1,53) = 1.4…Compute the forecasted values for Yt for July and August in 2020 by using the modelsstated in (c) and (d)
- Pink Table, a snack shop has recorded sales for its best-selling cold drink, shown as follows: Day 1 2 3 4 5 6 7 8 9 10 Jasmine Slush (12 oz) 125 136 127 123 142 148 139 140 154 158 a. Predict the sales for Jasmine Slush using the following forecasting methods: naïve (use simple naive method, forecast this period=actual value of last period); 3-day moving average method; weighted average method using the following weights: 45%,30%,25%; exponential smoothing with smoothing constant alpha equal to 10%, assume forecast for day 1 for each of the 3 products is the sales for day1; linear trend line. b. Using the results in a), compute the error ( MSE, MAD, and MAPE) for each of the methods used. c. Which forecasting technique will you recommend fo predict the sales of Jasmine Slush Explain and support your answer quantitatively.You fit a CAPM that regresses the excess return of Coca-cola on the excess market return using 20 years of monthly data. You estimate ∝=0,72, β=1,37, S2=20,38, σ2X=19,82 and μx=0,71. What are the standar errors of ∝ and β ?For the Hawkins Company, the monthly percentages of all shipments received on time over the past 12 months are 80, 82, 84, 83, 83, 84, 85, 84, 82, 83, 84, and 83. a. Compute for a 3 month moving average forecast. b. Compute for the exponential smoothing forecast for a=0.2. c. Which provides the better forecast using MSE as the measure of model accuracy? d. What is the forecast for next month?
- The manager of a travel agency has been using a seasonally adjusted forecast to predict demand for packaged tours. The actual and predicted values are as follows:Period Demand Predicted 1 132 113 2 192 200 3 152 150 4 87 102 5 82 80 6 127 135 7 122 128 8 133 124 9 98 109 10 153 150 11 108 94 12 93 80 13 128 140 14 138 128 a. Compute MAD for the fifth period, then update it period by period using exponential smoothing with α = 0.05.b. Compute a tracking signal…The accompanying dataset provides data on monthly unemployment rates for a certain region over four years. Compare 3- and 12-month moving average forecasts using the MAD criterion. Which of the two models yields better results? Explain. Find the MAD for the 3-month moving average forecast. MAD=? (Type an integer or decimal rounded to three decimal places as needed.) Year Month Rate(%) 2010 Jan 7.8 2010 Feb 8.2 2010 Mar 8.8 2010 Apr 9.1 2010 May 9.5 2010 Jun 9.3 2010 Jul 9.7 2010 Aug 9.6 2010 Sep 9.8 2010 Oct 10.1 2010 Nov 9.7 2010 Dec 9.8 2011 Jan 9.7 2011 Feb 9.9 2011 Mar 9.8 2011 Apr 9.9 2011 May 9.7 2011 Jun 9.4 2011 Jul 9.4 2011 Aug 9.3 2011 Sep 9.7 2011 Oct 9.3 2011 Nov 9.9 2011 Dec 9.5 2012 Jan 9.3 2012 Feb 8.8 2012 Mar 8.7 2012 Apr 9.1 2012 May 9.2 2012 Jun 9.2 2012 Jul 9.1 2012 Aug 9.1 2012 Sep 9.1 2012 Oct 8.9 2012 Nov 8.4 2012 Dec 8.3 2013 Jan 8.4 2013 Feb 8.1 2013 Mar 8.4 2013 Apr…Consider the following data:Monthly Profit of an Auto Repair Shop Month Jan-14 Feb-14 Mar-14 Apr-14 May-14 Jun-14 Jul-14 Aug-14 Sep-14 Profit ($) 17,527 17,677 16,455 18,642 20,163 17,350 19,127 18,622 20,422 Step 3 of 4 : Determine the exponential smoothing forecast for the next time period using a smoothing constant of 0.35. If necessary, round your answer to one decimal place. I have been stuck on this for 2 days now. I do not understand exponential smoothing forecast at all and the textbook is not helpful. I have tried looking at the textbook, using the step-by-step learning tools, and youtube videos and it still isn't helping.
- Approximately one-third of Canadians have some form of privately-covered long-term disability insurance. If random groups of 165 Canadians are sampled, find the range of values that the middle 95% of the sample proportions of those with long-term disability health insurance are likely to fall. = ? < p̂ < ? Round to four decimal places if necessary Enter 0 if normal approximation cannot be usedMembers of the millennial generation are continuing to be dependent on their parents (either living with or otherwise receiving support from parents) into early adulthood. A family research organization has claimed that, in past generations, no more than 30% of individuals aged 18 to 32 continued to be dependent on their parents. Suppose that a sample of 400 individuals aged 18 to 32 showed that 136 of them continue to be dependent on their parents. In Excel b. What is your point estimate of the proportion of millennials that are continuing to be dependent on their parents? c. What is the p-value provided by the sample data?According to Deloitte, through January 25,2006, the majority of companies reporting profits had beaten estimates. Now suppose that for the 4th quarter of 2012, 170 of a random sample of 280 companies reported profits that had beaten estimates. Does the data indicate the proportion of companies in the 4th quarter of 2012 that beat estimates is greater than 56% at α=0.05?