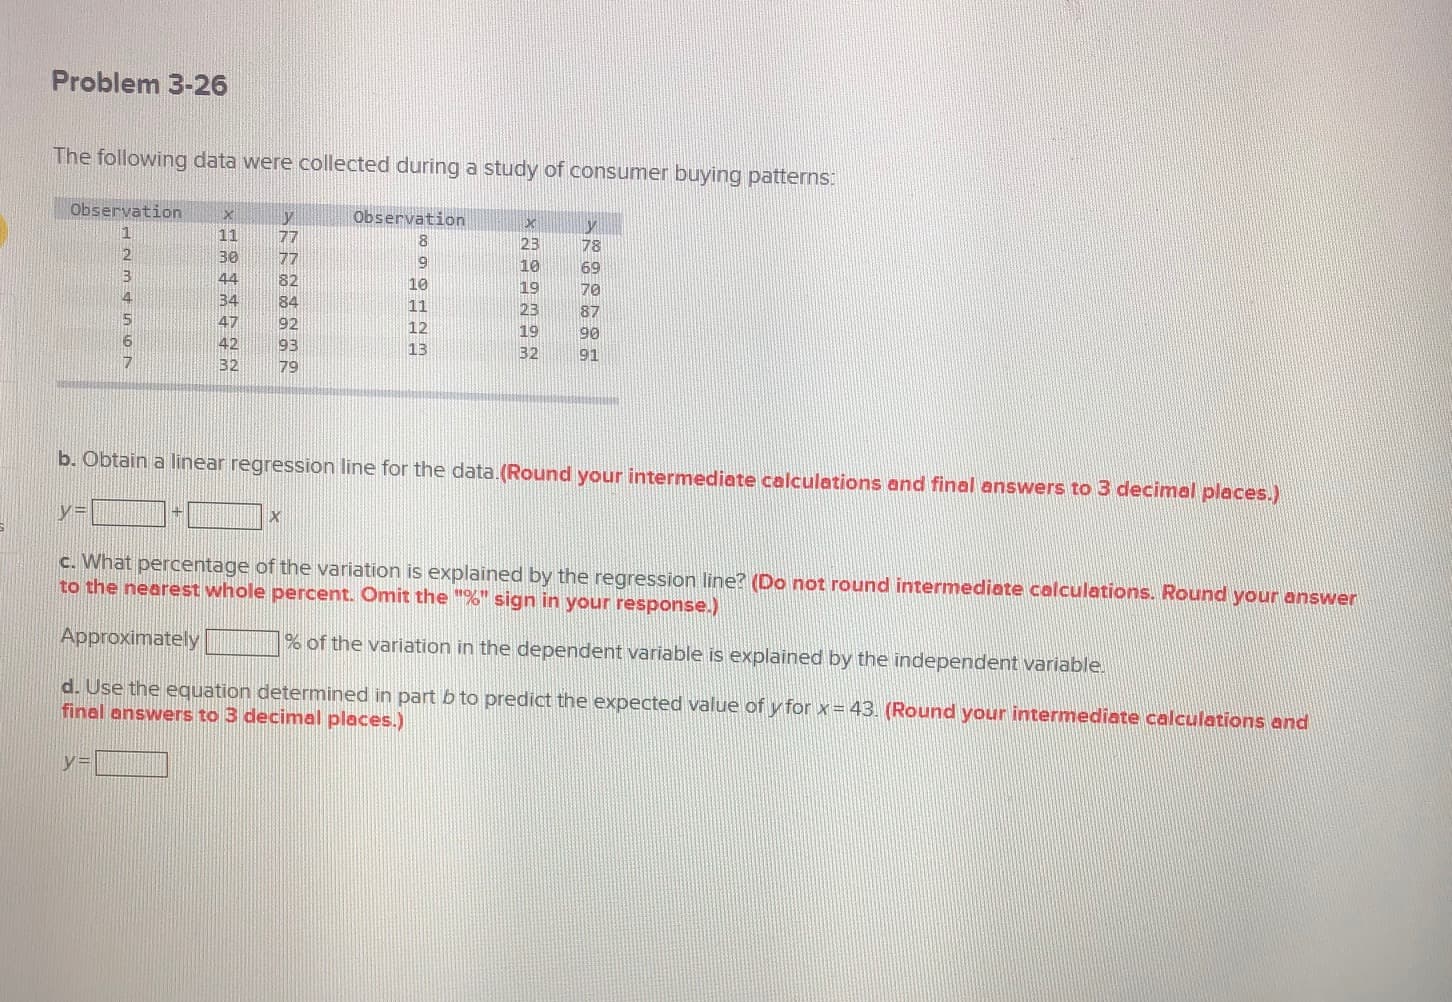
The following data were collected during a study of consumer buying patterns: Observation Observation 1 11 30 77 8. 23 78 77 9 10 69 44 82 10 19 70 34 84 11 23 87 47 92 12 19 90 42 93 13 32 91 32 79 b. Obtain a linear regression line for the data. (Round your intermediate calculations and final answers to 3 decimal places.) y= c. What percentage of the variation is explained by the regression line? (Do not round intermediate calculations. Round your answer to the nearest whole percent. Omit the "%" sign in your response.) Approximately % of the variation in the dependent variable is explained by the independent variable. d. Use the equation determined in part b to predict the expected value of y for x= 43. (Round your intermediate calculations and final answers to 3 decimal places.) %3D


Correlation
Correlation defines a relationship between two independent variables. It tells the degree to which variables move in relation to each other. When two sets of data are related to each other, there is a correlation between them.
Linear Correlation
A correlation is used to determine the relationships between numerical and categorical variables. In other words, it is an indicator of how things are connected to one another. The correlation analysis is the study of how variables are related.
Regression Analysis
Regression analysis is a statistical method in which it estimates the relationship between a dependent variable and one or more independent variable. In simple terms dependent variable is called as outcome variable and independent variable is called as predictors. Regression analysis is one of the methods to find the trends in data. The independent variable used in Regression analysis is named Predictor variable. It offers data of an associated dependent variable regarding a particular outcome.


Trending now
This is a popular solution!

Step by step
Solved in 4 steps with 3 images


