The following figure provides a grouped frequency distribution table, outlining the ages of 100 passengers on a flight from Cape Town to Johannesburg. In the seventh worksheet of your Excel answer book provided, create the following: 1 Age Of Passenger (Years) Number Of Passengers 2 5-< 15 3 15 -< 25 20 25 -< 35 34 5 35 -< 45 30 6 45-<55 12 Q.7.1 Construct a histogram to represent the information provided in the figure. The histogram must have a relevant title, descriptive axis labels, and must indicate the frequency of each category at the top of the relevant bar. Save the resultant chart in the worksheet.
The following figure provides a grouped frequency distribution table, outlining the ages of 100 passengers on a flight from Cape Town to Johannesburg. In the seventh worksheet of your Excel answer book provided, create the following: 1 Age Of Passenger (Years) Number Of Passengers 2 5-< 15 3 15 -< 25 20 25 -< 35 34 5 35 -< 45 30 6 45-<55 12 Q.7.1 Construct a histogram to represent the information provided in the figure. The histogram must have a relevant title, descriptive axis labels, and must indicate the frequency of each category at the top of the relevant bar. Save the resultant chart in the worksheet.

Glencoe Algebra 1, Student Edition, 9780079039897, 0079039898, 2018
18th Edition
ISBN:9780079039897
Author:Carter
Publisher:Carter
Chapter10: Statistics
Section10.6: Summarizing Categorical Data
Problem 4DGP

Related questions
Question
Transcribed Image Text:Question 7
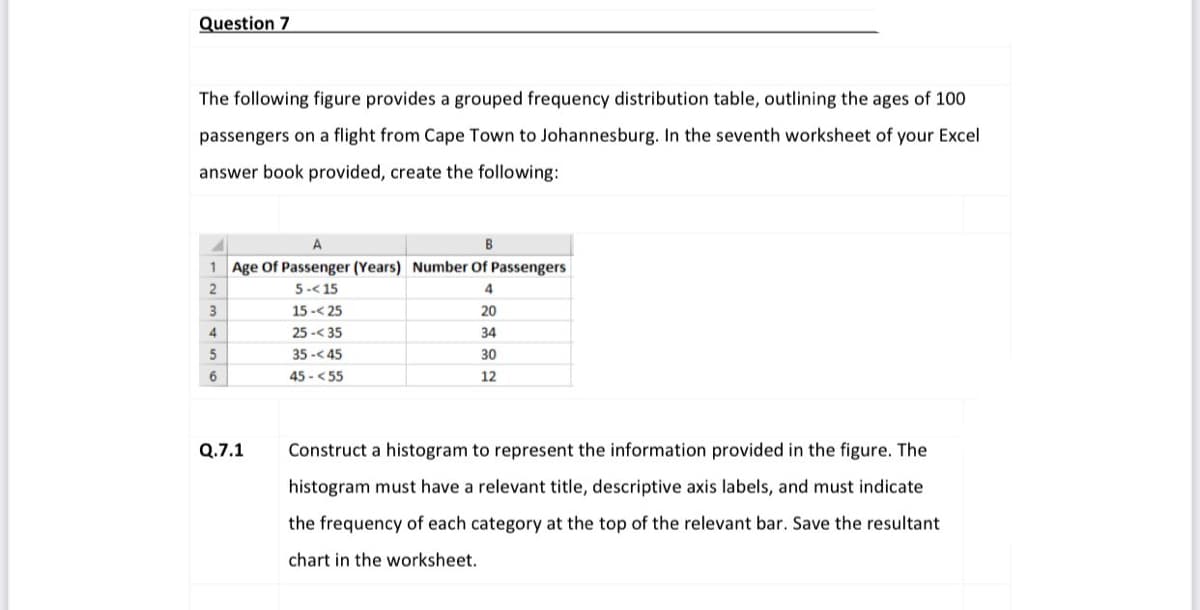
The following figure provides a grouped frequency distribution table, outlining the ages of 100
passengers on a flight from Cape Town to Johannesburg. In the seventh worksheet of your Excel
answer book provided, create the following:
A
1 Age Of Passenger (Years) Number Of Passengers
2
5-< 15
3
15 -< 25
20
25 -< 35
34
35 -< 45
30
6
45 - <55
12
Q.7.1
Construct a histogram to represent the information provided in the figure. The
histogram must have a relevant title, descriptive axis labels, and must indicate
the frequency of each category at the top of the relevant bar. Save the resultant
chart in the worksheet.
Expert Solution
This question has been solved!
Explore an expertly crafted, step-by-step solution for a thorough understanding of key concepts.

Step by step
Solved in 3 steps with 3 images

Knowledge Booster


Learn more about
Need a deep-dive on the concept behind this application? Look no further. Learn more about this topic, statistics and related others by exploring similar questions and additional content below.Recommended textbooks for you
Glencoe Algebra 1, Student Edition, 9780079039897…
Algebra
ISBN:
9780079039897
Author:
Carter
Publisher:
McGraw Hill
Glencoe Algebra 1, Student Edition, 9780079039897…
Algebra
ISBN:
9780079039897
Author:
Carter
Publisher:
McGraw Hill