The following graph gives the labor market for laboratory aides in the imaginary country of Sophos. The equilibrium hourly wage is $10, and the equilibrium number of laboratory aides is 250. Suppose the federal government of Sophos has decided to institute an hourly payroll tax of $4 on laboratory aides and wants to determine whether the tax should be levied on the workers, the employers, or both (in such a way that half the tax is collected from each party). Use the graph input tool to evaluate these three proposals. Entering a number into the Tax Levied on Employers field (initially set at zero dollars per hour) shifts the demand curve down by the amount you enter, and entering a number into the Tax Levied on Workers field (initially set at zero dollars per hour) shifts the supply curve up by the amount you enter. To determine the before-tax wage for each tax proposal, adjust the amount in the Wage field until the quantity of labor supplied equals the quantity of labor demanded. You will not be graded on any changes you make to this graph. Note: Once you enter a value in a white field, the graph and any corresponding amounts in each grey field will change accordingly. WAGE (Dollars per hour) 102828 ** ONA Tax Proposal 0 50 100 150 200 250 300 350 400 450 500 LABOR (Number of workers) Levied on Employers (Dollars per hour) Levied on Workers Supply (Dollars per hour) 0 Demand 4 2 D-Tax Graph Input Tool Market for Laboratory Aides Wage (Dollars per hour) Labor Demanded (Number of workers) Demand Shifter Tax Levied on Employers (Dollars per hour) For each of the proposals, use the previous graph to determine the new number of laboratory aides hired. Then compute the after-tax amount paid by employers (that is, the wage paid to workers plus any taxes collected from the employers) and the after-tax amount earned by laboratory aides (that is, the wage received by workers minus any taxes collected from the workers). Quantity Hired (Number of workers) 10 0 O The proposal in which the entire tax is collected from workers O The proposal in which the tax is collected from each side evenly O The proposal in which the tax is collected from employers O None of the proposals is better than the others Labor Supplied (Number of workers) Supply Shifter Tax Levied on Workers (Dollars per hour) After-Tax Wage Paid by Employers (Dollars per hour) 250 After-Tax Wage Received by Workers (Dollars per hour) Suppose the government doesn't want to discourage employers from hiring laboratory aides and, therefore, wants to minimize the share of the tax paid by the employers. Of the three tax proposals, which is best for accomplishing this goal?
The following graph gives the labor market for laboratory aides in the imaginary country of Sophos. The equilibrium hourly wage is $10, and the equilibrium number of laboratory aides is 250. Suppose the federal government of Sophos has decided to institute an hourly payroll tax of $4 on laboratory aides and wants to determine whether the tax should be levied on the workers, the employers, or both (in such a way that half the tax is collected from each party). Use the graph input tool to evaluate these three proposals. Entering a number into the Tax Levied on Employers field (initially set at zero dollars per hour) shifts the demand curve down by the amount you enter, and entering a number into the Tax Levied on Workers field (initially set at zero dollars per hour) shifts the supply curve up by the amount you enter. To determine the before-tax wage for each tax proposal, adjust the amount in the Wage field until the quantity of labor supplied equals the quantity of labor demanded. You will not be graded on any changes you make to this graph. Note: Once you enter a value in a white field, the graph and any corresponding amounts in each grey field will change accordingly. WAGE (Dollars per hour) 102828 ** ONA Tax Proposal 0 50 100 150 200 250 300 350 400 450 500 LABOR (Number of workers) Levied on Employers (Dollars per hour) Levied on Workers Supply (Dollars per hour) 0 Demand 4 2 D-Tax Graph Input Tool Market for Laboratory Aides Wage (Dollars per hour) Labor Demanded (Number of workers) Demand Shifter Tax Levied on Employers (Dollars per hour) For each of the proposals, use the previous graph to determine the new number of laboratory aides hired. Then compute the after-tax amount paid by employers (that is, the wage paid to workers plus any taxes collected from the employers) and the after-tax amount earned by laboratory aides (that is, the wage received by workers minus any taxes collected from the workers). Quantity Hired (Number of workers) 10 0 O The proposal in which the entire tax is collected from workers O The proposal in which the tax is collected from each side evenly O The proposal in which the tax is collected from employers O None of the proposals is better than the others Labor Supplied (Number of workers) Supply Shifter Tax Levied on Workers (Dollars per hour) After-Tax Wage Paid by Employers (Dollars per hour) 250 After-Tax Wage Received by Workers (Dollars per hour) Suppose the government doesn't want to discourage employers from hiring laboratory aides and, therefore, wants to minimize the share of the tax paid by the employers. Of the three tax proposals, which is best for accomplishing this goal?

Chapter29: Resource Markets
Section: Chapter Questions
Problem 15E

Related questions
Question
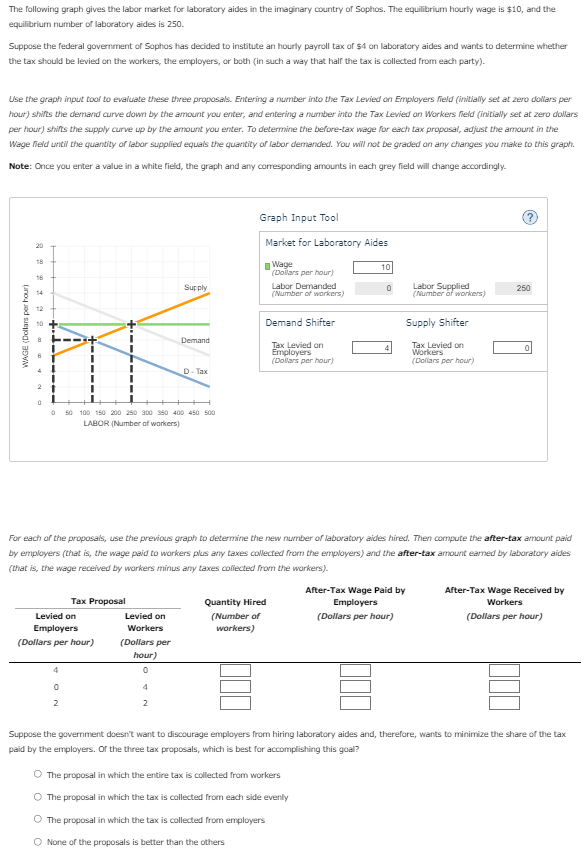
Transcribed Image Text:The following graph gives the labor market for laboratory aides in the imaginary country of Sophos. The equilibrium hourly wage is $10, and the
equilibrium number of laboratory aides is 250.
Suppose the federal government of Sophos has decided to institute an hourly payroll tax of $4 on laboratory aides and wants to determine whether
the tax should be levied on the workers, the employers, or both (in such a way that half the tax is collected from each party).
Use the graph input tool to evaluate these three proposals. Entering a number into the Tax Levied on Employers field (initially set at zero dollars per
hour) shifts the demand curve down by the amount you enter, and entering a number into the Tax Levied on Workers field (initially set at zero dollars
per hour) shifts the supply curve up by the amount you enter. To determine the before-tax wage for each tax proposal, adjust the amount in the
Wage field until the quantity of labor supplied equals the quantity of labor demanded. You will not be graded on any changes you make to this graph.
Note: Once you enter a value in a white field, the graph and any corresponding amounts in each grey field will change accordingly.
WAGE (Dollars per hour)
20
18
0 50 100 150 200 250 300 350 400 450 500
LABOR (Number of workers)
Levied on
Employers
(Dollars per hour)
4
0
Tax Proposal
2
Levied on
Workers
Supply
(Dollars per
hour)
0
Demand
4
2
D-Tax
Graph Input Tool
Market for Laboratory Aides
Wage
(Dollars per hour)
For each of the proposals, use the previous graph to determine the new number of laboratory aides hired. Then compute the after-tax amount paid
by employers (that is, the wage paid to workers plus any taxes collected from the employers) and the after-tax amount earned by laboratory aides
(that is, the wage received by workers minus any taxes collected from the workers).
Labor Demanded
(Number of workers)
Quantity Hired
(Number of
workers)
Demand Shifter
Tax Levied on
Employers
(Dollars per hour)
10
0
The proposal in which the entire tax is collected from workers
O The proposal in which the tax is collected from each side evenly
O The proposal in which the tax is collected from employers
O None of the proposals is better than the others
Labor Supplied
(Number of workers)
After-Tax Wage Paid by
Employers
(Dollars per hour)
Supply Shifter
Tax Levied on
Workers
(Dollars per hour)
250
After-Tax Wage Received by
Workers
(Dollars per hour)
Suppose the government doesn't want to discourage employers from hiring laboratory aides and, therefore, wants to minimize the share of the tax
paid by the employers. Of the three tax proposals, which is best for accomplishing this goal?
Expert Solution
This question has been solved!
Explore an expertly crafted, step-by-step solution for a thorough understanding of key concepts.

This is a popular solution!

Trending now
This is a popular solution!

Step by step
Solved in 6 steps with 3 images

Knowledge Booster


Learn more about
Need a deep-dive on the concept behind this application? Look no further. Learn more about this topic, economics and related others by exploring similar questions and additional content below.Recommended textbooks for you