The following graph shows the annual market for Florida oranges, which are sold in units of 90-pound boxes. Use the graph input tool to help you answer the following questions. You will not be graded on any changes you make to this graph. Note: Once you enter a value in a white field, the graph and any corresponding amounts in each grey field will change accordingly. Graph Input Tool Market for Florida Oranges 50 Price (Dollars per box) 15 45 Supply Quantity Supplied (Mlions of baxes 40 378 Quantity Demanded (Milions of boxes) 900 Demand 10 90 180 27o 300 400 540 630 720 10 000 QUANTITY (Millions of baxes) million boxes. per box, and the equilibrium quantity of oranges is alihrium price is s In this market, the equilibrium price is S per bax, and the equilibrium quantity of oranges is million boxes For each price listed in the following table, determine the quantity of oranges demanded, the quantity of oranges suppled, and the direction of pressure exerted on prices in the absence of any price contrels Price Quantity Demanded Quantity Supplied (Dollars per bax) (Millions of boxes) (Millions of boxes) Pressure on Prices 30 20 True or False: A price ceiling below $25 per bax is not a binding price ceiling in this market. (Economists call a price ceiing that prevents the market from reaching equilibrium a binding price celling.) O True O Fatse PRICE (Dolars per box)
The following graph shows the annual market for Florida oranges, which are sold in units of 90-pound boxes. Use the graph input tool to help you answer the following questions. You will not be graded on any changes you make to this graph. Note: Once you enter a value in a white field, the graph and any corresponding amounts in each grey field will change accordingly. Graph Input Tool Market for Florida Oranges 50 Price (Dollars per box) 15 45 Supply Quantity Supplied (Mlions of baxes 40 378 Quantity Demanded (Milions of boxes) 900 Demand 10 90 180 27o 300 400 540 630 720 10 000 QUANTITY (Millions of baxes) million boxes. per box, and the equilibrium quantity of oranges is alihrium price is s In this market, the equilibrium price is S per bax, and the equilibrium quantity of oranges is million boxes For each price listed in the following table, determine the quantity of oranges demanded, the quantity of oranges suppled, and the direction of pressure exerted on prices in the absence of any price contrels Price Quantity Demanded Quantity Supplied (Dollars per bax) (Millions of boxes) (Millions of boxes) Pressure on Prices 30 20 True or False: A price ceiling below $25 per bax is not a binding price ceiling in this market. (Economists call a price ceiing that prevents the market from reaching equilibrium a binding price celling.) O True O Fatse PRICE (Dolars per box)

Chapter1: Introducing The Economic Way Of Thinking
Section1.A: Applying Graphs To Economics
Problem 2SQP

Related questions
Question
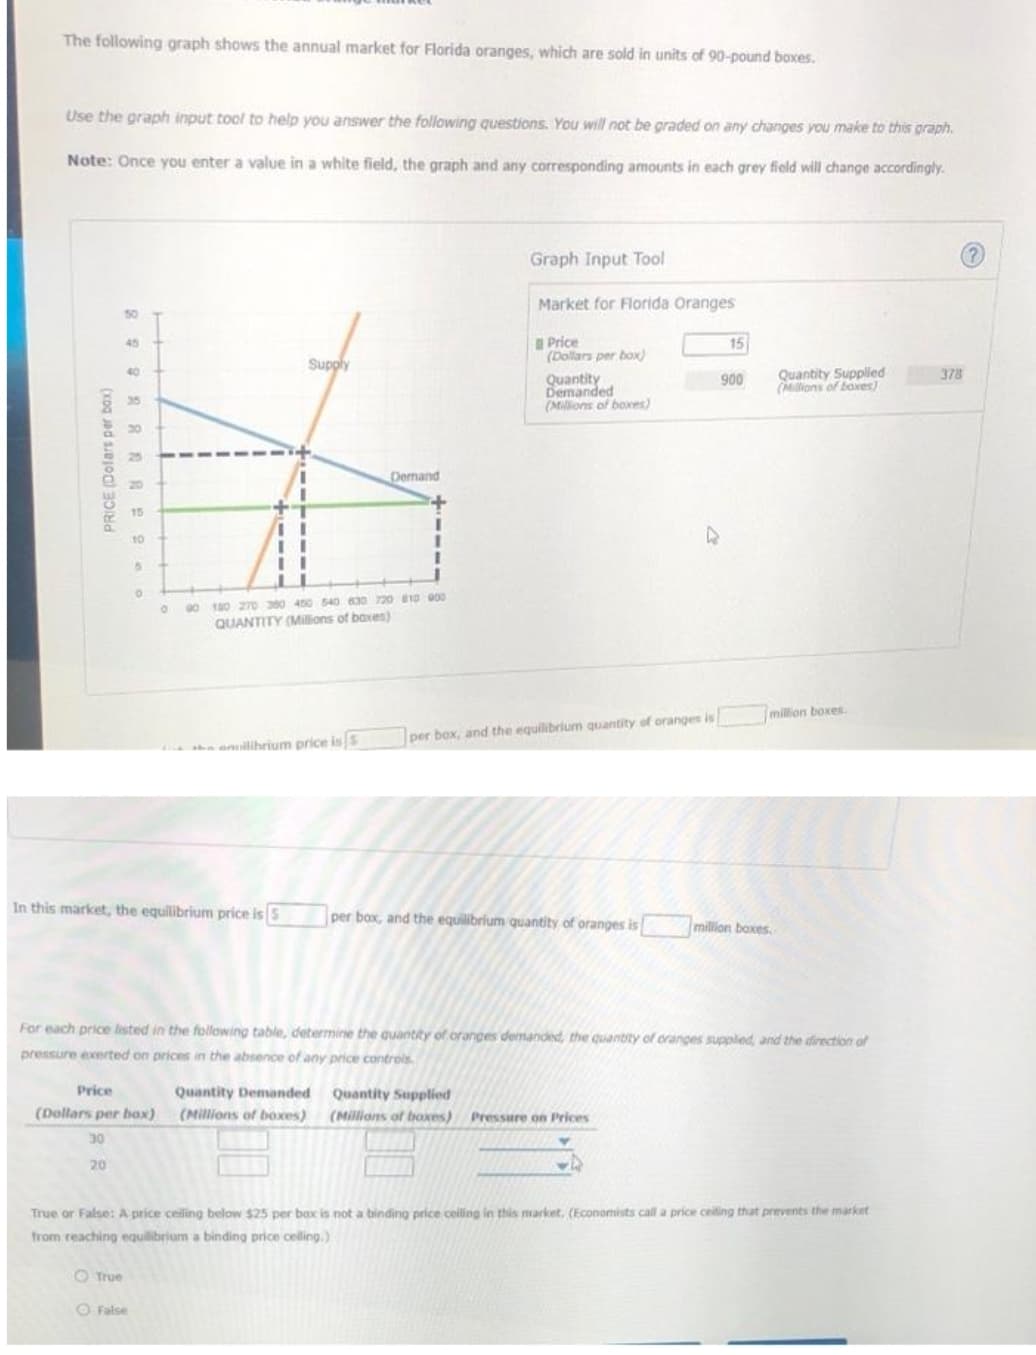
Transcribed Image Text:The following graph shows the annual market for Florida oranges, which are sold in units of 90-pound boxes.
Use the graph input tool to help you answer the following questions. You will not be graded on any changes you make to this graph.
Note: Once you enter a value in a white field, the graph and any corresponding amounts in each grey field will change accordingly.
Graph Input Tool
Market for Florida Oranges
50
Price
(Dollars per box
45
15
Supply
Quantity Supplied
(Mlions of baes
40
378
Quantity
Demanded
(Millions of boxes)
900
35
30
Demand
20
15
10
00 180 270 300 400 540 630 720 810 000
QUANTITY (Milions of baxes)
million boxes.
per box, and the equilibrium quantity of oranges is
a ailihrium price is s
In this market, the equilibrium price is S
per bax, and the equilibrium quantity of oranges is
million boxes.
For each price listed in the following table, determine the quantity of oranges demanded, the quiantity of oranges suppled, and the direction of
pressure exerted on prices in the absence of any price controls
Price
Quantity Demanded Quantity Supplied
(Dollars per bax)
(Millions of boxces) (Millions of boxes)
Pressure on Prices
30
20
True or False: A price ceiling below $25 per bax is not a binding price ceiling in this market, (Economists call a price celing that prevents the market
from reaching eauilibrium a binding price celling,)
O True
O False
PRICE (Dolars per box)
Expert Solution
This question has been solved!
Explore an expertly crafted, step-by-step solution for a thorough understanding of key concepts.

This is a popular solution!

Trending now
This is a popular solution!

Step by step
Solved in 4 steps

Recommended textbooks for you


