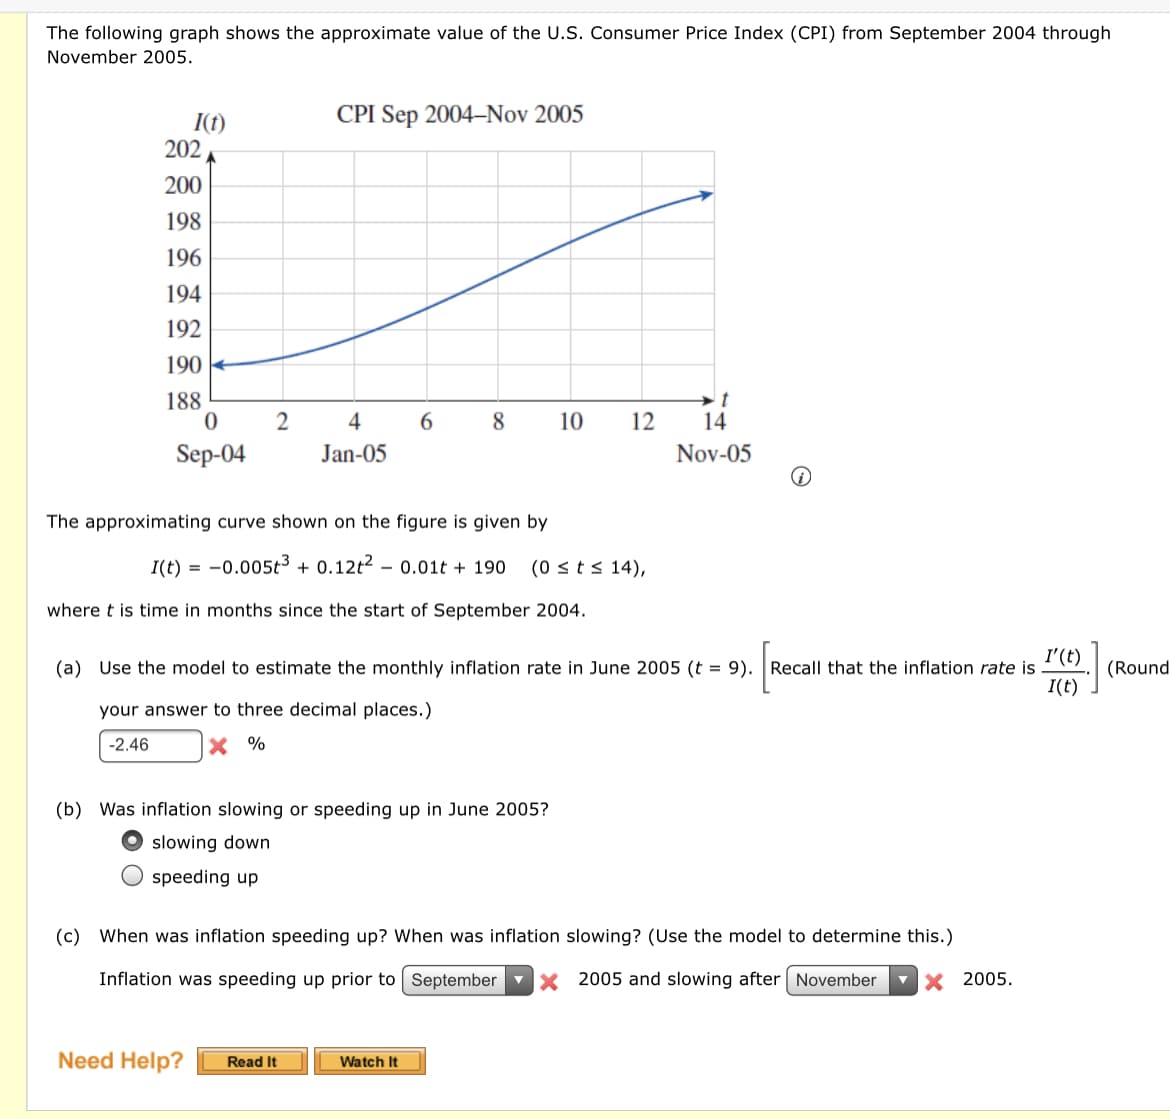
The following graph shows the approximate value of the U.S. Consumer Price Index (CPI) from September 2004 through November 2005. CPI Sep 2004–Nov 2005 I(t) 202 200 198 196 194 192 190 - 188 →t 14 4 6. 8 10 12 Sep-04 Jan-05 Nov-05 The approximating curve shown on the figure is given by I(t) = -0.005t3 + 0.12t2 – 0.01t + 190 (0 st s 14), where t is time in months since the start of September 2004. I'(t) (a) Use the model to estimate the monthly inflation rate in June 2005 (t = 9). Recall that the inflation rate is (Round I(t) your answer to three decimal places.) -2.46 X % (b) Was inflation slowing or speeding up in June 2005? O slowing down speeding up (c) When was inflation speeding up? When was inflation slowing? (Use the model to determine this.) Inflation was speeding up prior to September X 2005 and slowing after November V X 2005.
The following graph shows the approximate value of the U.S. Consumer Price Index (CPI) from September 2004 through November 2005. CPI Sep 2004–Nov 2005 I(t) 202 200 198 196 194 192 190 - 188 →t 14 4 6. 8 10 12 Sep-04 Jan-05 Nov-05 The approximating curve shown on the figure is given by I(t) = -0.005t3 + 0.12t2 – 0.01t + 190 (0 st s 14), where t is time in months since the start of September 2004. I'(t) (a) Use the model to estimate the monthly inflation rate in June 2005 (t = 9). Recall that the inflation rate is (Round I(t) your answer to three decimal places.) -2.46 X % (b) Was inflation slowing or speeding up in June 2005? O slowing down speeding up (c) When was inflation speeding up? When was inflation slowing? (Use the model to determine this.) Inflation was speeding up prior to September X 2005 and slowing after November V X 2005.

Functions and Change: A Modeling Approach to College Algebra (MindTap Course List)
6th Edition
ISBN:9781337111348
Author:Bruce Crauder, Benny Evans, Alan Noell
Publisher:Bruce Crauder, Benny Evans, Alan Noell
Chapter1: Functions
Section1.2: Functions Given By Tables
Problem 32SBE: Does a Limiting Value Occur? A rocket ship is flying away from Earth at a constant velocity, and it...

Related questions
Question
Transcribed Image Text:The following graph shows the approximate value of the U.S. Consumer Price Index (CPI) from September 2004 through
November 2005.
CPI Sep 2004–Nov 2005
I(t)
202
200
198
196
194
192
190 +
188
2
4
8.
10
12
14
Sep-04
Jan-05
Nov-05
The approximating curve shown on the figure is given by
I(t) = -0.005t3 + 0.12t2 – 0.01t + 190
(0 st s 14),
where t is time in months since the start of September 2004.
I'(t)
(a) Use the model to estimate the monthly inflation rate in June 2005 (t = 9). Recall that the inflation rate is
I(t)
(Round
your answer to three decimal places.)
-2.46
X %
(b) Was inflation slowing or speeding up in June 2005?
slowing down
O speeding up
(c) When was inflation speeding up? When was inflation slowing? (Use the model to determine this.)
Inflation was speeding up prior to September vx 2005 and slowing after November
VX 2005.
Need Help?
Read It
Watch It
Expert Solution
This question has been solved!
Explore an expertly crafted, step-by-step solution for a thorough understanding of key concepts.

This is a popular solution!

Trending now
This is a popular solution!

Step by step
Solved in 2 steps

Recommended textbooks for you
Functions and Change: A Modeling Approach to Coll…
Algebra
ISBN:
9781337111348
Author:
Bruce Crauder, Benny Evans, Alan Noell
Publisher:
Cengage Learning

Algebra & Trigonometry with Analytic Geometry
Algebra
ISBN:
9781133382119
Author:
Swokowski
Publisher:
Cengage

Big Ideas Math A Bridge To Success Algebra 1: Stu…
Algebra
ISBN:
9781680331141
Author:
HOUGHTON MIFFLIN HARCOURT
Publisher:
Houghton Mifflin Harcourt
Functions and Change: A Modeling Approach to Coll…
Algebra
ISBN:
9781337111348
Author:
Bruce Crauder, Benny Evans, Alan Noell
Publisher:
Cengage Learning
Algebra & Trigonometry with Analytic Geometry
Algebra
ISBN:
9781133382119
Author:
Swokowski
Publisher:
Cengage
Big Ideas Math A Bridge To Success Algebra 1: Stu…
Algebra
ISBN:
9781680331141
Author:
HOUGHTON MIFFLIN HARCOURT
Publisher:
Houghton Mifflin Harcourt

Algebra and Trigonometry (MindTap Course List)
Algebra
ISBN:
9781305071742
Author:
James Stewart, Lothar Redlin, Saleem Watson
Publisher:
Cengage Learning