The following graph shows the market for croissants in Denver, where there are over a thousand bakeries at any given moment. Suppose an innovation in the baking process makes it possible to produce more croissants at a lower cost than ever before. Show the effect of this change on the market for croissants by shifting one or both of the curves on the following graph, holding all else constant. PRICE (Dollars per croissant) QUANTITY (Croissants) Supply Demand 11 Demand 0 Supply
The following graph shows the market for croissants in Denver, where there are over a thousand bakeries at any given moment. Suppose an innovation in the baking process makes it possible to produce more croissants at a lower cost than ever before. Show the effect of this change on the market for croissants by shifting one or both of the curves on the following graph, holding all else constant. PRICE (Dollars per croissant) QUANTITY (Croissants) Supply Demand 11 Demand 0 Supply

Chapter3: Market Demand And Supply
Section: Chapter Questions
Problem 4SQ

Related questions
Question
Not sure what to change
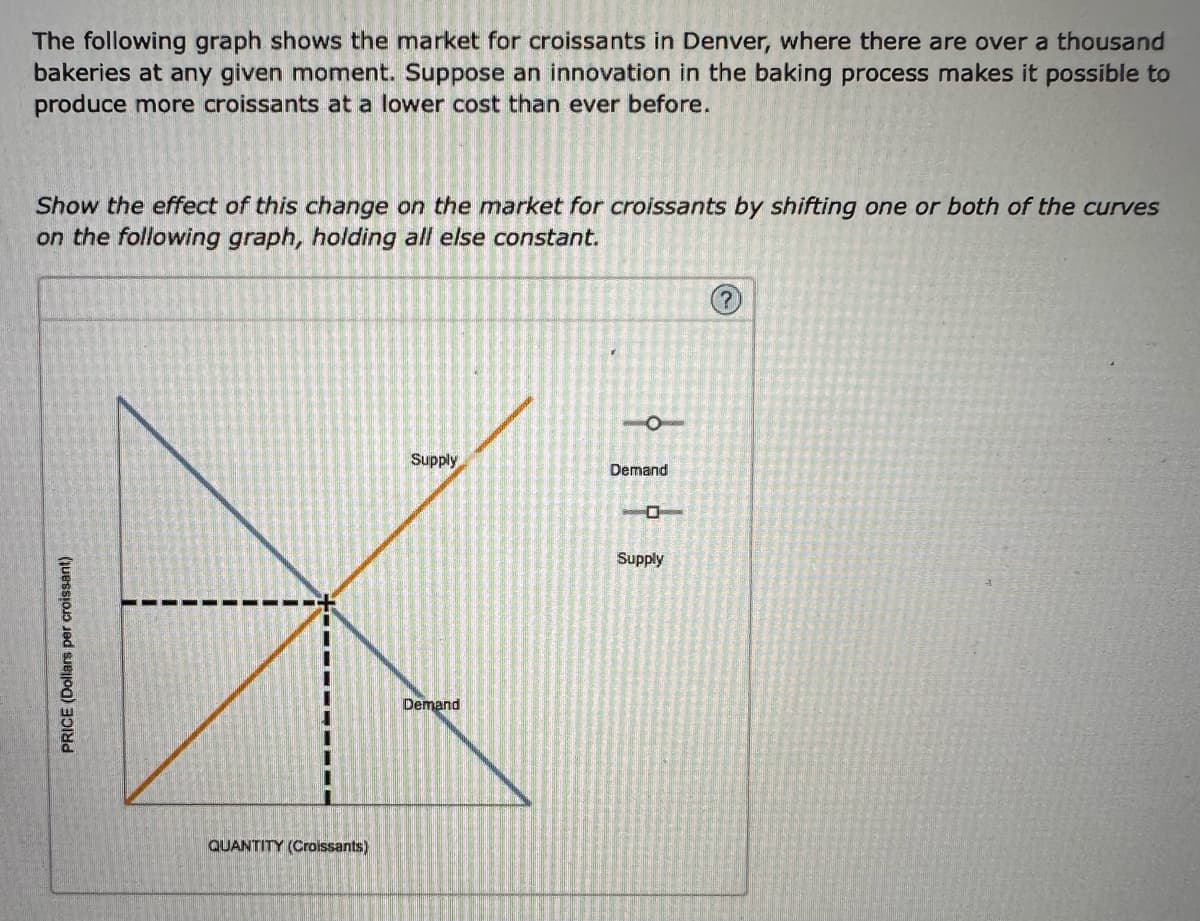
Transcribed Image Text:The following graph shows the market for croissants in Denver, where there are over a thousand
bakeries at any given moment. Suppose an innovation in the baking process makes it possible to
produce more croissants at a lower cost than ever before.
Show the effect of this change on the market for croissants by shifting one or both of the curves
on the following graph, holding all else constant.
PRICE (Dollars per croissant)
QUANTITY (Croissants)
Supply
Demand
O
Demand
Supply
(?)
Expert Solution
INTRODUCTION
Since, now the baker can produce at lower cost. Producer can supply more quantity at given price. Hence the supply curve will shift to the right.

Trending now
This is a popular solution!

Step by step
Solved in 2 steps with 1 images

Knowledge Booster


Learn more about
Need a deep-dive on the concept behind this application? Look no further. Learn more about this topic, economics and related others by exploring similar questions and additional content below.Recommended textbooks for you


Exploring Economics
Economics
ISBN:
9781544336329
Author:
Robert L. Sexton
Publisher:
SAGE Publications, Inc
