The following sample data reflect shipments received by a large firm from three different vendors and the quality of those shipments. (You may find it useful to reference the appropriate table: chi-square table or Etable) Vendor Defective Acceptable 14 112 70 150 10 22 a. Select the competing hypotheses to determine whether quality is associated with the source of the shipments. O No Quality and source of shipment (vendor) are independent: H Quality and source of shipment (vendor) are dependent. OM Quality and source of shipment (vendor) are dependent; Ha Quality and source of shipment (vendor) are independent. b-1. Calculate the value of the test statistic (Round intermediate calculations to at least 4 decimal places and final answer to 3 decimal places.) Tost statisio b-2. Find the pvalue O pvalue > 001 O 001s pvalue < 0.025 O 0025 s pvalue <005 O 005 s pvalue <010
The following sample data reflect shipments received by a large firm from three different vendors and the quality of those shipments. (You may find it useful to reference the appropriate table: chi-square table or Etable) Vendor Defective Acceptable 14 112 70 150 10 22 a. Select the competing hypotheses to determine whether quality is associated with the source of the shipments. O No Quality and source of shipment (vendor) are independent: H Quality and source of shipment (vendor) are dependent. OM Quality and source of shipment (vendor) are dependent; Ha Quality and source of shipment (vendor) are independent. b-1. Calculate the value of the test statistic (Round intermediate calculations to at least 4 decimal places and final answer to 3 decimal places.) Tost statisio b-2. Find the pvalue O pvalue > 001 O 001s pvalue < 0.025 O 0025 s pvalue <005 O 005 s pvalue <010

Glencoe Algebra 1, Student Edition, 9780079039897, 0079039898, 2018
18th Edition
ISBN:9780079039897
Author:Carter
Publisher:Carter
Chapter4: Equations Of Linear Functions
Section: Chapter Questions
Problem 8SGR

Related questions
Question
3
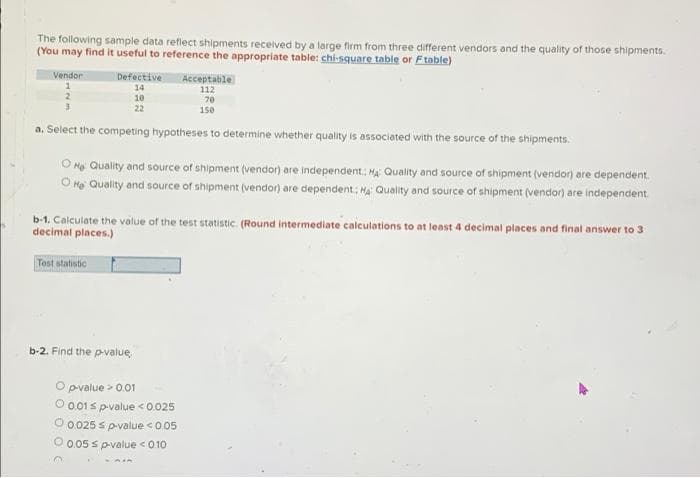
Transcribed Image Text:The following sample data reflect shipments received by a large firm from three different vendors and the quality of those shipments.
(You may find it useful to reference the appropriate table: chi-square table or Ftable)
Vendor
Defective
Acceptable
112
70
14
10
22
150
a. Select the competing hypotheses to determine whether quality is associated with the source of the shipments.
O Mo Quality and source of shipment (vendor) are independent: Ma: Quality and source of shipment (vendor) are dependent.
O Mo Quality and source of shipment (vendor) are dependent; Ha Quality and source of shipment (vendor) are independent.
b-1. Calculate the value of the test statistic (Round intermediate calculations to at least 4 decimal places and final answer to 3
decimal places.)
Tost atatistic
b-2. Find the p-value,
O pvalue > 0.01
O 0.01 s p-value <0.025
O 0.025 s p-value <0.05
O 0.05 s pvalue <0.10
Expert Solution
This question has been solved!
Explore an expertly crafted, step-by-step solution for a thorough understanding of key concepts.

This is a popular solution!

Trending now
This is a popular solution!

Step by step
Solved in 3 steps with 3 images

Recommended textbooks for you
Glencoe Algebra 1, Student Edition, 9780079039897…
Algebra
ISBN:
9780079039897
Author:
Carter
Publisher:
McGraw Hill
Glencoe Algebra 1, Student Edition, 9780079039897…
Algebra
ISBN:
9780079039897
Author:
Carter
Publisher:
McGraw Hill