The following table contains observed frequencies for a sample of 200. Column Variable Row Variable A в P 30 46 65 Q 20 24 15 Test for independence of the row and column variables using a = 0.05 . Compute the value of the x test statistic (to 2 decimals). Use Table 3 of Appendix B to find the p-value. The p-value is - Select your answer - What is your conclusion? Select your answer
Q: A civil engineer tested two different types (A and B) of a special reinforced concrete beam. He made…
A: 1. The hypotheses are given below: Null hypothesis: H0: There is no real difference between the two…
Q: The following table contains observed frequencies for a sample of 265 . Column Variable Row…
A: State the hypotheses. Null hypothesis: Alternative hypothesis:
Q: The following table summarizes the results of a two-factor ANOVA evaluating an independent-measures…
A: Factor A has two levels , degrees of freedom = 2-1 = 1 Factor B has three levels , degrees of…
Q: An electrical engineer is interested in the effect on the tube conductivity of five different types…
A:
Q: wenty laboratory mice were randomly divided into two groups of 10. Each group was fed according to a…
A: A B 7 18 14 15 5 22 11 9 8 22 10 8 11 22 8 14 9 16 14 19…
Q: The following data gives the weights of 20 randomly selected samples of a certain product. Assume…
A: Given : Assume that the weights are normally distributed Sample size (n) = 20 Weight 12 11…
Q: Two plots at Rothamsted Experimental Station were studied for production of wheat straw. For a…
A: Given: One Plot Second Plot 6.4 7.1 7.03 7.03 7.17 8.15 6.96 5.91 7.31 7.22 7.18…
Q: "Dr. Broadus found a significant effect of alcohol consuption on dance partner attractiveness…
A: (25)
Q: A lab technician is tested for her consistency by taking multiple measurements of cholesterol levels…
A: Chi-square statistic: Chi-square statistic measures the difference between the observed frequencies…
Q: . A paired-difference experiment was conducted to compare the means of two populations: Pairs…
A: Solution: Let x= Population 1 and y = Population 2 x y d=x-y (d-d) (d-d)2 1.3 1.2 0.1 0.04…
Q: The data from an independent-measures research study produce a sample mean difference of 4 points…
A: The provided information are:
Q: A fruit grower wants to test a new spray that a manufacturer claims will reduce the loss due to…
A: Given Data : For Sample 1 x̄1 = 109 σ1 = 20.1246 n1 = 200 For Sample 2…
Q: The following values are from an independent- sures study comparing three treatment conditior…
A: Solution: Given information: n1= 10 Sample size of treatment 1n2= 10 Sample size of treatment 2n3=…
Q: The following data represent the results from an independent-measures experiment comparing three…
A:
Q: Ten men were selected to test an exercise device by using it 4 times per week for 30 minutes Their…
A: There are two dependent samples which are before and after the exercise device. We have to test…
Q: The following table contains observed frequencies for a sample of 200. Row Variable Column Variable…
A: Given: The data is given below in the table. A B C P 25 52 45 Q 25 18 35 N=200α=0.05
Q: (a) Find t. (Give your answer correct to two decimal places.) This answer is 2.46 (ii) Find the…
A: We have used the excel data analysis tool to run the t-test
Q: You may need to use the appropriate technology to answer this question. The following table contains…
A:
Q: The following table contains observed frequencies for a sample of 200. Column Variable Row Variable…
A: The given contingency table is, The formula for calculating the expected counts for each cell is,
Q: In a Nicd battery, a fully charged cell is composed of nickelic hydroxide. Nickel is an element that…
A:
Q: An article in the ASCE Journal of Energy Engineering describes a study of the thermal inertia…
A: The given null and alternative hypothesis are- Ho : μ = 22.5 Versus H1 : μ ≠ 22.5 i.e. we have to…
Q: he types of browse favored by deer are shown in the following table. Using binoculars, volunteers…
A:
Q: Five subjects are repeatedly measured under 3 different conditions and the following data were…
A: The table of five subjects are repeatedly measured under 3 different conditions : Subject 1 2 3…
Q: The following data represent the results from an independent-measures experiment comparing three…
A: Hello! As you have posted more than 3 sub parts, we are answering the first 3 sub-parts. In case…
Q: 10. Based on SPSS output shown below, is the hypothesis that treatment group (1) scores are greater…
A: Introduction: Denote μ1, μ2 as the true population mean scores for the treatment group (1) and…
Q: Mr. Acosta, a sociologist, is doing a study to see if there is a relationship between the age of a…
A: Formula : Test statistic
Q: Twenty laboratory mice were randomly divided into two groups of 10. Each group was fed according to…
A:
Q: Two independent samples of 8 and 7 items respectively have the following values of the variables:…
A: Please note that as per our company's guidelines if multiple questions are posted we can answer only…
Q: What are the conditions of the independent variable? What is the dependent variable? b. What are Ho…
A: As per our guidelines, we are allowed to answer three sub-parts. Please post other parts again.…
Q: Two different foods were tested for the difference in weight gains. A random sample of 6 mice was…
A: Given: n1 = 6 n2 = 8 Level of significance α = 0.05 Formula Used: μu = n1n22 σu2 = n1n2(n1+n2+1)12…
Q: The following table contains observed frequencies for a sample of 255. Column Variable Row Variable…
A: We have given that Two varaibles : Row and Column Sample size (n)=255 Significance level =0.05…
Q: "Dr. Broadus found a significant effect of alcohol consuption on dance partner attractiveness…
A:
Q: Consider the following data on marks obtained in Quizzes 1 and 2 by a sample of 10 students enrolled…
A: The following data is given, Quiz 1 Quiz 2 5 20 15 16 12 12 13 10 15 14 14 15 13…
Q: "Dr. Broadus found a significant effect of alcohol consuption on dance partner attractiveness…
A: (25)
Q: An article in the ASCE Journal of Energy Engineering describes a study of the thermal inertia…
A:
Q: A manager of a product sales group believes the number of sales made by an employee (Y) depends on…
A: 8) It is been asked to construct multiple regression model for the given data and find the value of…
Q: The following table contains observed frequencies for a sample of 260. Column Variable Row Variable…
A: Chi square χ2 association test is the suitable method to determine the relationship (or) association…
Q: The weights of a sample of newborn calves are recorded in the table below: 43.0 Male weight (kg)…
A:
Q: following table contains observed frequencies for a sample of 200 . Column Variable Row…
A: The table given is as follows A B C P 20 46 40 106 Q 30 24 40 94 50 70 80 200…
Q: The following table contains observed frequencies for a sample of 200. Column Variable Row Variable…
A: It is needed to test, whether the row and column variances are independent.
Q: Q4. The following table contains observed frequencies for a sample of 240. Test for independence of…
A: Given a sample of 240. α = 0.05. Test for the independence of the row and column variables…
Q: 4. The following table contains observed frequencies for a sample of 240. Test for independence of…
A: Chi-Square of independence is a test used for categorical variables in order to assess the degree of…
Q: The following table shows the results of an analysis of variance comparing four treatment conditions…
A: The number of treatments k is 4.
Q: an article in the ASCE Journal of Energy Engineering describes a study of the thermal inertia…
A: We have given that Sample size n =5 Population mean =22.5
Q: You may need to use the appropriate technology to answer this question. Submitted The following…
A: The row and column variables are given.
Q: State the null hypothesis. 2) Calculate necessary statistics (USE AN ANOVA even though K=2, and a =…
A:
Q: Here is a link to a data set concerning treatment groups A and B. Before performing a t-test to…
A: The sample variance for the Group A is 412.8289 by the Excel function “=VAR.S(A1:A20)”, here, the…
Q: A. CONSIDER that the data is CORRELATED use alpha .05. Provide the following: 1. Number of…
A: Since you have posted a question with multiple subparts, we will solve first three subparts for you.…
Q: Q1. The following data are from a completely randomized design. Treatment A B C 155 148 128…
A: The following table is obtained: A B C 155 148 128 147 152 126 165 124 138 145…
Q: The following table contains observed frequencies for a sample of 200. Column Variable Row Variable…
A: For the given data, we need to test for independence of the row and column variables using 0.05…
Need help solving and what steps to take in excel
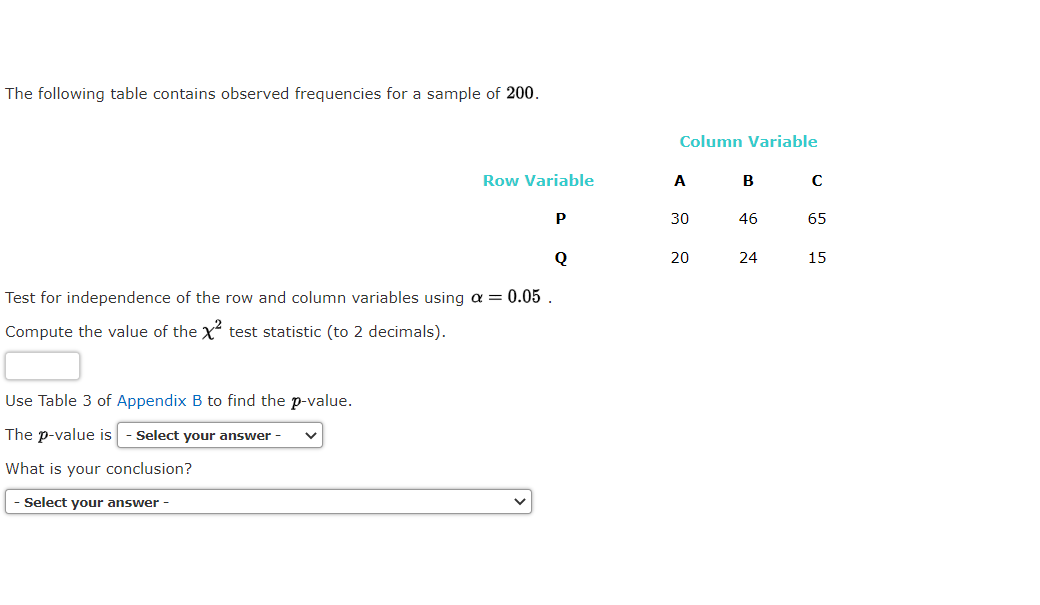
Trending now
This is a popular solution!
Step by step
Solved in 4 steps
- The manufacturer of a new eye cream claims that the cream reduces the appearance of fine lines and wrinkles after just 1414 days of application. To test the claim, 10 women are randomly selected to participate in a study. The number of fine lines and wrinkles that are visible around each participant’s eyes is recorded before and after the 14 days of treatment. The following table displays the results. Test the claim at the 0.01 level of significance assuming that the population distribution of the paired differences is approximately normal. Let women before the treatment be Population 1 and let women after the treatment be Population 2. Number of Fine Lines and Wrinkles Before 13 14 10 15 15 9 10 14 9 10 After 11 14 11 14 14 8 11 12 5 7 Step 2 of 3 : Compute the value of the test statistic. Round your answer to three decimal places. Step 3 of 3: Reject or fail? Is there enough evidenceThe data in the table below presents the hourly quantity of production for three lines of production processes over the first 4 days in XYZ Company. Answer the questions based on the Excel Output given in the picture below. State the null and alternative hypothesis for single factor ANOVA. State the decision rule (α = 0.05). Calculate the test statistic. Make a decision.Researchers conducted a study investigating the number of viralinfections people contracted as a function of their stress over a 6-month period. Use the provided steps to conduct a one-factor between-subjects ANOVA that test whether there are any differences in number of infections across the four conditions.a. State the hypotheses. b. Determine the critical value for an alpha level of 0.05.
- list all the variables (listed in the rows) that showed significant associations with participants' sex (male/female) using the p-values listed in the corresponding p-value column (significance was less or equal to alpha 0.05)An agriculture company wants to determine if a new fertilizer has a significant effect on crop yields. The null hypothesis is that the fertilizer has no effect on crop yields, meaning that the average yield with the fertilizer is equal to the average yield without the fertilizer. The company conducts an ANOVA test and obtains an F-statistic of 3.2 and a numerator degrees of freedom of 3 and denominator degrees of freedom of 20. What is the p-value of the hypothesis test?The manufacturer of a new eye cream claims that the cream reduces the appearance of fine lines and wrinkles after just 14 days of application. To test the claim, 10 women are randomly selected to participate in a study. The number of fine lines and wrinkles that are visible around each participants eyes is recorded before and after the 14 days of treatment. The following table displays the results. Test the claim at the 0.02 level of significance assuming that the population distribution of the paired differences is approximately normal. Let women before the treatment be Population 2. Before: 10, 11, 14, 11, 9, 11, 12, 14, 11, 14 After: 8, 11, 13 , 11, 5, 7, 13, 12, 8, 10 Question 1 : Compute the value of the test statistic. Round your answer to three decimal places. Additionally Question 2: Draw a conclusion and interpret the decision.
- The manufacturer of a new eye cream claims that the cream reduces the appearance of fine lines and wrinkles after just 1414 days of application. To test the claim, 1010 women are randomly selected to participate in a study. The number of fine lines and wrinkles that are visible around each participant’s eyes is recorded before and after the 1414 days of treatment. The following table displays the results. Test the claim at the 0.050.05 level of significance assuming that the population distribution of the paired differences is approximately normal. Let women before the treatment be Population 1 and let women after the treatment be Population 2. Number of Fine Lines and Wrinkles Before 12 11 10 14 12 9 12 14 9 12 After 13 8 6 14 11 6 13 11 5 11 Step 2 of 3 : Compute the value of the test statistic. Round your answer to three decimal places.The manufacturer of a new eye cream claims that the cream reduces the appearance of fine lines and wrinkles after just 14 days of application. To test the claim, 10 women are randomly selected to participate in a study. The number of fine lines and wrinkles that are visible around each participant’s eyes is recorded before and after the 14 days of treatment. The following table displays the results. Test the claim at the 0.05 level of significance assuming that the population distribution of the paired differences is approximately normal. Let women before the treatment be Population 1 and let women after the treatment be Population 2. Number of Fine Lines and WrinklesBefore 11 14 13 12 15 14 9 11 11 14After 10 14 11 13 13 13 8 12 10 15 Step 1 of 3 : State the n ull and alternative hypotheses for the test. Fill in the blank below. H0Ha: μd=0: μd⎯⎯⎯⎯⎯⎯⎯⎯⎯⎯⎯⎯⎯⎯⎯0 3) draw a conclusion and form a decision (word it like "we…The manufacturer of a new eye cream claims that the cream reduces the appearance of fine lines and wrinkles after just 14 days of application. To test the claim, 10 women are randomly selected to participate in a study. The number of fine lines and wrinkles that are visible around each participant’s eyes is recorded before and after the 14 days of treatment. The following table displays the results. Test the claim at the 0.05 level of significance assuming that the population distribution of the paired differences is approximately normal. Let women before the treatment be Population 1 and let women after the treatment be Population 2. Number of Fine Lines and Wrinkles Before 9 9 10 15 13 9 9 10 9 14 After 6 10 10 12 9 6 9 7 8 14 Copy Data Step 2 of 3 : Compute the value of the test statistic. Round your answer to three decimal places.
- A clinical trial is conducted to compare a new pain relief for arthritis to a placebo. Participants are randomly assigned to receive the new medication or a placebo, and the outcome is pain relief within 30 minutes. The data are shown in Table 7–8. Is there a significant difference in the proportions of patients reporting pain relief? Run the test at a 5% level of significance. (Use Excel; compute the overall proportion, then the z-test statistic and finally the p-value using norm.dist.)One researcher is comparing scores from two treatment groups using independent samples t test. He would like to know whether the assumption of homogeneity of variance is met. Please first explain what is homogeneity of variance. Then conduct the Hartley’s F-max test to examine this assumption (each group has 6 participants, s2 in group 1 is 20, and s2 in group 2 is 15, set alpha level at .05). Finally, based on the result of the Hartley’s F-max test, how should this researcher estimate the standard error in the independent samples t test?In a random sample of males, it was found that 25 write with their left hands and 222 do not. In a random sample of females, it was found that 68 write with their left hands and 450 do not. Use a 0.01significance level to test the claim that the rate of left-handedness among males is less than that among females. Identify the test statistic. z enter your response here Identify the test statistic. z=enter your response here