The following table contains observed frequencies for a sample of 260. Column Variable Row Variable A. B P 20 35 20 35 55 10 25 20 40 Test for independence of the row and column variables using a = 0.05. Compute the value of the x test statistic (to 3 decimals). Use Table 3 of Appendix B to find the p-value. The p-value is - Select your answer - - Select your answer What is your cless than 0.01 between 0.01 and 0.025 Select your a between 0.025 and 0.05 variable is not independent of the row variable. between 0.05 and 0.10 greater than 0.10
The following table contains observed frequencies for a sample of 260. Column Variable Row Variable A. B P 20 35 20 35 55 10 25 20 40 Test for independence of the row and column variables using a = 0.05. Compute the value of the x test statistic (to 3 decimals). Use Table 3 of Appendix B to find the p-value. The p-value is - Select your answer - - Select your answer What is your cless than 0.01 between 0.01 and 0.025 Select your a between 0.025 and 0.05 variable is not independent of the row variable. between 0.05 and 0.10 greater than 0.10

MATLAB: An Introduction with Applications
6th Edition
ISBN:9781119256830
Author:Amos Gilat
Publisher:Amos Gilat
Chapter1: Starting With Matlab
Section: Chapter Questions
Problem 1P

Related questions
Question
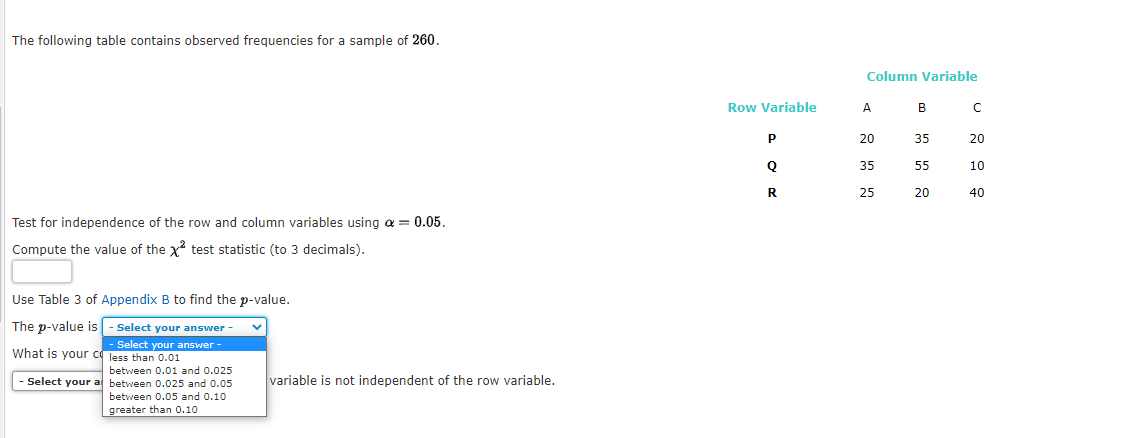
Transcribed Image Text:The following table contains observed frequencies for a sample of 260.
Column Variable
Row Variable
A
B
20
35
20
35
55
10
R
25
20
40
Test for independence of the row and column variables using a = 0.05.
Compute the value of the x test statistic (to 3 decimals).
Use Table 3 of Appendix B to find the p-value.
The p-value is - Select your answer -
- Select your answer -
What is your c less than 0.01
between 0.01 and 0.025
Select your al between 0.025 and 0.05
variable is not independent of the row variable.
between 0.05 and 0.10
greater than 0.10
Expert Solution
This question has been solved!
Explore an expertly crafted, step-by-step solution for a thorough understanding of key concepts.

This is a popular solution!

Trending now
This is a popular solution!

Step by step
Solved in 2 steps with 3 images

Recommended textbooks for you
MATLAB: An Introduction with Applications
Statistics
ISBN:
9781119256830
Author:
Amos Gilat
Publisher:
John Wiley & Sons Inc

Probability and Statistics for Engineering and th…
Statistics
ISBN:
9781305251809
Author:
Jay L. Devore
Publisher:
Cengage Learning

Statistics for The Behavioral Sciences (MindTap C…
Statistics
ISBN:
9781305504912
Author:
Frederick J Gravetter, Larry B. Wallnau
Publisher:
Cengage Learning
MATLAB: An Introduction with Applications
Statistics
ISBN:
9781119256830
Author:
Amos Gilat
Publisher:
John Wiley & Sons Inc
Probability and Statistics for Engineering and th…
Statistics
ISBN:
9781305251809
Author:
Jay L. Devore
Publisher:
Cengage Learning
Statistics for The Behavioral Sciences (MindTap C…
Statistics
ISBN:
9781305504912
Author:
Frederick J Gravetter, Larry B. Wallnau
Publisher:
Cengage Learning

Elementary Statistics: Picturing the World (7th E…
Statistics
ISBN:
9780134683416
Author:
Ron Larson, Betsy Farber
Publisher:
PEARSON

The Basic Practice of Statistics
Statistics
ISBN:
9781319042578
Author:
David S. Moore, William I. Notz, Michael A. Fligner
Publisher:
W. H. Freeman

Introduction to the Practice of Statistics
Statistics
ISBN:
9781319013387
Author:
David S. Moore, George P. McCabe, Bruce A. Craig
Publisher:
W. H. Freeman