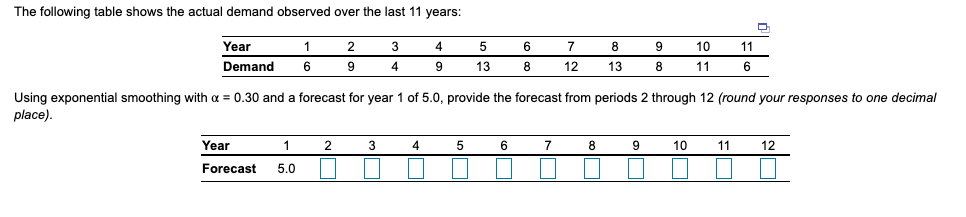
The following table shows the actual demand observed over the last 11 years: Year 1 2 4 7 8 10 11 Demand 6 9 4 9 13 12 13 11 6 Using exponential smoothing with a = 0.30 and a forecast for year 1 of 5.0, provide the forecast from periods 2 through 12 (round your responses to one decimal place). Year 1 4 5 6 7 8 10 11 12 Forecast 5.0


Q: snip
A: Answer: It is important to measure the accuracy of forecasts, for any forecasting technique and…
Q: If your forecast for 2022 is 40, using the seasonal index below, what is your forecast for 2nd…
A: Seasonal forecast = Forecast for a period * Seasonal index of that period Given, Total forecast = 40…
Q: three-period moving average. A weighted average using weights of .50 (most recent), .20 and .30.…
A: forecasting is a method which helps to predict the unknown future based on the known past…
Q: Please show work
A:
Q: (4) Weekly demand for dry pasta at a supermarket chain is as follows Week Demands 1 517 2 510…
A:
Q: Tracy is the the Director of Supply Chain at Circuits Inc. An accurate forecast at Circuits Inc. is…
A: Error = Actual demand - Forecast Absolute Error = Positive Value of Error MAD = Average of Absolute…
Q: The historical data for 4 periods demand are 65, 60, 80, and 70 respectively. Calculate the weighted…
A: The answers would be as follows:
Q: (a) Compute a weighted average forecast for the data listed below using a weight of 0.40 for the…
A:
Q: No single forecast methodology is appropriate under all conditions True or false?
A: Answer: What is Forecasting: Forecasting is an attempt to predict future events which will be used…
Q: The demand data for Double T Computer Services appears below. The company wants you to forecast the…
A: THE ANSWER IS AS BELOW:
Q: forecast for weeks 7-24 using 6 week weighted moving average
A: Weighted moving average is a forecasting model which helps to identify the forecasting using the…
Q: The following table shows the actual demand observed over the last 11 years: year 1 2…
A: We can calculate a three-year forecast by using the formula- Three-year moving average method ( Year…
Q: After plotting the following demand data, a manager has concluded that a trend-adjusted exponential…
A: Given- α=0.6β=0.5 Month At (Actual) 1 208 2 219 3 232 4 244 5 258 6 268 7 285 8…
Q: The following table shows the actual demand observed over the last 11 years: Year 1 2 3 4 6. 7 8 10…
A:
Q: 2. Develop an aggregate plan for the following forecast eriod 2 3 5 6 1 4 8 Total recast 1,200 1,200…
A: Consideration: Negative inventory in opening and ending inventory represent Backlogs.
Q: Daily high temperatures in st. Louis for the last week were as follows:…
A: Given information:Temperatures in last week is 33,33,38,36,43,23,28
Q: Calculate the forecast for the 4th quarter of 2016 using the Weighted average method w1-0.7, w2=0.3.…
A: Weighted average forecast uses different weights which are assigned to past data to predict the data…
Q: Short term forecast can be used for the following operation.
A: Short term forecastUp to 1 year, usually less than 3 monthsPurchasing, job planning, staff levels,…
Q: The following table shows the actual demand observed over the last 11 years: Year Demand 1 2 7 10 3…
A: Forecast for Year 4 = (Sum of Demand of Year 3,Year 2, Year 1) / 3 Year 4 5 6 7 8…
Q: Café Michigan's manager, Gary Stark, suspects that demand for mocha latte coffees depends on the…
A: Linear Regression Assume X = Price Y = Number sold X Y XY X2 2.50…
Q: Demand and forecast for 5 months are given below: Month Demand Forecast 1 50 46 2 52 52 3…
A: Tracking Signal is used to determine the larger deviation (in both plus and minus) of Error in…
Q: Compute the weighted average forecast using the following weights: 0.20, 0.30, 0.10, and 0.40
A:
Q: Sales of tablet computers at Ted Glickman's electronics store in Washington, D.C., over the past…
A: A) Formulae used : Forecast = (1 - smoothing factor) * Most recent period forecast) + (Smoothing…
Q: orecast demand for each week, including week 10, using exponential smoothing with a 5 .5 (initial…
A: Exponential smoothing is forecasting method which identifying the farecasting value based on the…
Q: Using seasonal relatives. Apple’s Citrus Fruit Farm ships boxed fruit anywhere in the world.…
A:
Q: Storrs Cycles has just started selling the new Cyclone mountain bike, with monthly sales as shown in…
A: Since you have posted a question with multiple sub-parts, we will solve the first three subparts for…
Q: The following table shows the actual demand observed over the last 11 years:…
A:
Q: they need a good forecast so that they will know how many fabrics to purchase and stock. For the…
A: The controlling input of the exponential smoothing calculation is defined as the smoothing factor…
Q: 1. The Southern Pizza Parlor is a small restaurant. One of the customers' favorites is Southern…
A: Forecasting helps to know the sales of the product in advance so that appropriate stock levels are…
Q: (a) Suppose the data in the table below represents total revenues (in $ millions) for one real…
A: Below is the solution:-
Q: DEMAND FOR FERTILIZER YEAR (1,000S OF BAGS) 1 4 2 6 3 4 4 5 5 10 6…
A: Since we only answer up to 3 sub-parts, we’ll answer the first 3. Please resubmit the question and…
Q: Consider the following yearly demand values for a particular product. Year Demand 1 360 2 389 410 4…
A: The technical analysis methods used to smooth the data price by creating a regular updated average…
Q: Consider the following time series data. Week 1 2 3 4 5 6 Value 18 14 15 11 18 13 Using the…
A: Given information, Week Value 1 18 2 14 3 15 4 11 5 18 6 13 Total week = 6
Q: Sales of tablet computers at Ted Glickman’s electron-ics store in Washington, D.C., over the past 10…
A: Formula:
Q: True Beauty is a cosmetics company that uses exponentialsmoothing with trend to forecast monthly…
A: Given data In the solution, three equations will be used to develop forecasts including trends.…
Q: what is the advantage of using double exponential smoothing over regression?
A: You can use both double exponential smoothing and regression to forecast a demand pattern with a…
Q: a. Compute a weighted average forecast using a weight of 0.4 for the most recent period, 0.3 for the…
A: A weighted moving average forecast is a forecast of future values based on past values. A weighted…
Q: The department manager is using a combination of methods to forecast sales of toasters at a local…
A: Weighted moving average means we have different weights and we calculate on previous months data as…
Q: How does this forecast differ from that using employment as the independent variable? What is the…
A: Forecasting is a method of making well-informed forecasts regarding the direction of future trends…
Q: Sales for a product for the past three months have been 203, 365, and 293. Use a three-month moving…
A:
Q: Interpret the MAD of the most accurate among the forecasting models below. A. Naïve approach; B.…
A: Find the Given details below: Given Details: Month Demand (100 Liters) 1 39 2 47 3 39 4…
Q: Café Michigan's manager, Gary Stark, suspects that demand for mocha latte coffees depends on the…
A: Given data: X Y 2.60 770 3.60 505 2.00 975 4.20 250 3.10 315 4.00 490 19.50 3305
Q: The following table shows the actual demand observed over the last 11 years:…
A: Given Information:
Q: 5. Demand for patient surgery at Washington General Hospital has increased steadily in the past few…
A: Forecasting is the process of estimating the future demand and sales based on the previous month or…
Q: Local city government statistics show the rate of new driver’s license applications to be as…
A:
Please look at the picture attached below and answer the questions! Thank you so much!


Trending now
This is a popular solution!

Step by step
Solved in 2 steps with 2 images

- The Baker Company wants to develop a budget to predict how overhead costs vary with activity levels. Management is trying to decide whether direct labor hours (DLH) or units produced is the better measure of activity for the firm. Monthly data for the preceding 24 months appear in the file P13_40.xlsx. Use regression analysis to determine which measure, DLH or Units (or both), should be used for the budget. How would the regression equation be used to obtain the budget for the firms overhead costs?The file P13_22.xlsx contains total monthly U.S. retail sales data. While holding out the final six months of observations for validation purposes, use the method of moving averages with a carefully chosen span to forecast U.S. retail sales in the next year. Comment on the performance of your model. What makes this time series more challenging to forecast?The file P13_42.xlsx contains monthly data on consumer revolving credit (in millions of dollars) through credit unions. a. Use these data to forecast consumer revolving credit through credit unions for the next 12 months. Do it in two ways. First, fit an exponential trend to the series. Second, use Holts method with optimized smoothing constants. b. Which of these two methods appears to provide the best forecasts? Answer by comparing their MAPE values.
- The file P13_02.xlsx contains five years of monthly data on sales (number of units sold) for a particular company. The company suspects that except for random noise, its sales are growing by a constant percentage each month and will continue to do so for at least the near future. a. Explain briefly whether the plot of the series visually supports the companys suspicion. b. By what percentage are sales increasing each month? c. What is the MAPE for the forecast model in part b? In words, what does it measure? Considering its magnitude, does the model seem to be doing a good job? d. In words, how does the model make forecasts for future months? Specifically, given the forecast value for the last month in the data set, what simple arithmetic could you use to obtain forecasts for the next few months?The owner of a restaurant in Bloomington, Indiana, has recorded sales data for the past 19 years. He has also recorded data on potentially relevant variables. The data are listed in the file P13_17.xlsx. a. Estimate a simple regression equation involving annual sales (the dependent variable) and the size of the population residing within 10 miles of the restaurant (the explanatory variable). Interpret R-square for this regression. b. Add another explanatory variableannual advertising expendituresto the regression equation in part a. Estimate and interpret this expanded equation. How does the R-square value for this multiple regression equation compare to that of the simple regression equation estimated in part a? Explain any difference between the two R-square values. How can you use the adjusted R-squares for a comparison of the two equations? c. Add one more explanatory variable to the multiple regression equation estimated in part b. In particular, estimate and interpret the coefficients of a multiple regression equation that includes the previous years advertising expenditure. How does the inclusion of this third explanatory variable affect the R-square, compared to the corresponding values for the equation of part b? Explain any changes in this value. What does the adjusted R-square for the new equation tell you?The file P13_26.xlsx contains the monthly number of airline tickets sold by the CareFree Travel Agency. a. Create a time series chart of the data. Based on what you see, which of the exponential smoothing models do you think will provide the best forecasting model? Why? b. Use simple exponential smoothing to forecast these data, using a smoothing constant of 0.1. c. Repeat part b, but search for the smoothing constant that makes RMSE as small as possible. Does it make much of an improvement over the model in part b?
- The file P13_29.xlsx contains monthly time series data for total U.S. retail sales of building materials (which includes retail sales of building materials, hardware and garden supply stores, and mobile home dealers). a. Is seasonality present in these data? If so, characterize the seasonality pattern. b. Use Winters method to forecast this series with smoothing constants = = 0.1 and = 0.3. Does the forecast series seem to track the seasonal pattern well? What are your forecasts for the next 12 months?The file P13_28.xlsx contains monthly retail sales of U.S. liquor stores. a. Is seasonality present in these data? If so, characterize the seasonality pattern. b. Use Winters method to forecast this series with smoothing constants = = 0.1 and = 0.3. Does the forecast series seem to track the seasonal pattern well? What are your forecasts for the next 12 months?Scenario 3 Ben Gibson, the purchasing manager at Coastal Products, was reviewing purchasing expenditures for packaging materials with Jeff Joyner. Ben was particularly disturbed about the amount spent on corrugated boxes purchased from Southeastern Corrugated. Ben said, I dont like the salesman from that company. He comes around here acting like he owns the place. He loves to tell us about his fancy car, house, and vacations. It seems to me he must be making too much money off of us! Jeff responded that he heard Southeastern Corrugated was going to ask for a price increase to cover the rising costs of raw material paper stock. Jeff further stated that Southeastern would probably ask for more than what was justified simply from rising paper stock costs. After the meeting, Ben decided he had heard enough. After all, he prided himself on being a results-oriented manager. There was no way he was going to allow that salesman to keep taking advantage of Coastal Products. Ben called Jeff and told him it was time to rebid the corrugated contract before Southeastern came in with a price increase request. Who did Jeff know that might be interested in the business? Jeff replied he had several companies in mind to include in the bidding process. These companies would surely come in at a lower price, partly because they used lower-grade boxes that would probably work well enough in Coastal Products process. Jeff also explained that these suppliers were not serious contenders for the business. Their purpose was to create competition with the bids. Ben told Jeff to make sure that Southeastern was well aware that these new suppliers were bidding on the contract. He also said to make sure the suppliers knew that price was going to be the determining factor in this quote, because he considered corrugated boxes to be a standard industry item. Is Ben Gibson acting legally? Is he acting ethically? Why or why not?
- Scenario 3 Ben Gibson, the purchasing manager at Coastal Products, was reviewing purchasing expenditures for packaging materials with Jeff Joyner. Ben was particularly disturbed about the amount spent on corrugated boxes purchased from Southeastern Corrugated. Ben said, I dont like the salesman from that company. He comes around here acting like he owns the place. He loves to tell us about his fancy car, house, and vacations. It seems to me he must be making too much money off of us! Jeff responded that he heard Southeastern Corrugated was going to ask for a price increase to cover the rising costs of raw material paper stock. Jeff further stated that Southeastern would probably ask for more than what was justified simply from rising paper stock costs. After the meeting, Ben decided he had heard enough. After all, he prided himself on being a results-oriented manager. There was no way he was going to allow that salesman to keep taking advantage of Coastal Products. Ben called Jeff and told him it was time to rebid the corrugated contract before Southeastern came in with a price increase request. Who did Jeff know that might be interested in the business? Jeff replied he had several companies in mind to include in the bidding process. These companies would surely come in at a lower price, partly because they used lower-grade boxes that would probably work well enough in Coastal Products process. Jeff also explained that these suppliers were not serious contenders for the business. Their purpose was to create competition with the bids. Ben told Jeff to make sure that Southeastern was well aware that these new suppliers were bidding on the contract. He also said to make sure the suppliers knew that price was going to be the determining factor in this quote, because he considered corrugated boxes to be a standard industry item. As the Marketing Manager for Southeastern Corrugated, what would you do upon receiving the request for quotation from Coastal Products?Suppose that a regional express delivery service company wants to estimate the cost of shipping a package (Y) as a function of cargo type, where cargo type includes the following possibilities: fragile, semifragile, and durable. Costs for 15 randomly chosen packages of approximately the same weight and same distance shipped, but of different cargo types, are provided in the file P13_16.xlsx. a. Estimate a regression equation using the given sample data, and interpret the estimated regression coefficients. b. According to the estimated regression equation, which cargo type is the most costly to ship? Which cargo type is the least costly to ship? c. How well does the estimated equation fit the given sample data? How might the fit be improved? d. Given the estimated regression equation, predict the cost of shipping a package with semifragile cargo.Play Things is developing a new Lady Gaga doll. The company has made the following assumptions: The doll will sell for a random number of years from 1 to 10. Each of these 10 possibilities is equally likely. At the beginning of year 1, the potential market for the doll is two million. The potential market grows by an average of 4% per year. The company is 95% sure that the growth in the potential market during any year will be between 2.5% and 5.5%. It uses a normal distribution to model this. The company believes its share of the potential market during year 1 will be at worst 30%, most likely 50%, and at best 60%. It uses a triangular distribution to model this. The variable cost of producing a doll during year 1 has a triangular distribution with parameters 15, 17, and 20. The current selling price is 45. Each year, the variable cost of producing the doll will increase by an amount that is triangularly distributed with parameters 2.5%, 3%, and 3.5%. You can assume that once this change is generated, it will be the same for each year. You can also assume that the company will change its selling price by the same percentage each year. The fixed cost of developing the doll (which is incurred right away, at time 0) has a triangular distribution with parameters 5 million, 7.5 million, and 12 million. Right now there is one competitor in the market. During each year that begins with four or fewer competitors, there is a 25% chance that a new competitor will enter the market. Year t sales (for t 1) are determined as follows. Suppose that at the end of year t 1, n competitors are present (including Play Things). Then during year t, a fraction 0.9 0.1n of the company's loyal customers (last year's purchasers) will buy a doll from Play Things this year, and a fraction 0.2 0.04n of customers currently in the market ho did not purchase a doll last year will purchase a doll from Play Things this year. Adding these two provides the mean sales for this year. Then the actual sales this year is normally distributed with this mean and standard deviation equal to 7.5% of the mean. a. Use @RISK to estimate the expected NPV of this project. b. Use the percentiles in @ RISKs output to find an interval such that you are 95% certain that the companys actual NPV will be within this interval.


