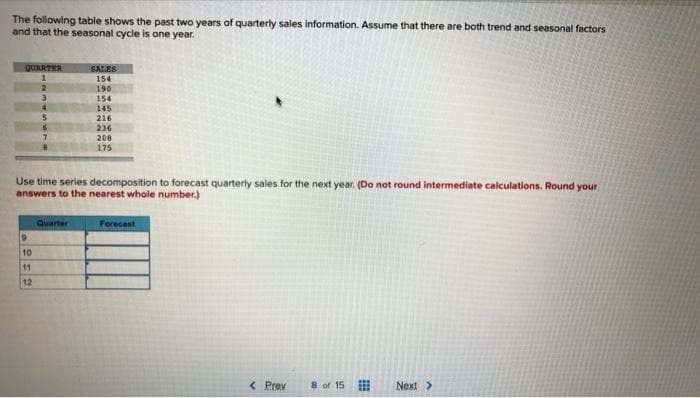
The following table shows the past two years of quarterly sales information. Assume that there are both trend and seasonal factors and that the seasonal cycle is one year. QUARTER SALES 154 190 154 145 5. 216 236 208 175 Use time series decomposition to forecast quarterly sales for the next year. (Do not round intermediate calculations. Round your answers to the nearest whole number.) Quarter Forecest 19 10 11 12


Q: A quality control manager wants to check the accuracy of the exponential smoothing with trend…
A: Find the given details below: Given details: Period Actual Sales Quarter 1 200 Quarter 2…
Q: My App is a small but growing start-up that sees demand for several of its apps increasing quickly.…
A: Double exponential smoothing is a forecasting model which identify the forecasting with the…
Q: Using the data given in the following table, if the seasonal index for quarter 3 is 1.12, what…
A: Find the Given details below: Given details: Year Quarter 2019 2020 1 120 113 2 135…
Q: 4.2 2 3. 4 6. 7 8. 6. 10 11 YEAR 1 7 9. 9. 13 8. 12 13 6. 11 7 DEMAND a) Plot the above data on a…
A: A) On observing, it is concluded that it is a cyclic trend as the demand depicts an increase and…
Q: In the Atlanta area, the number of daily calls for the repair of Speedy copy machines has been…
A: Given data-
Q: Thamer Almutairi, owner of Almutairi's DepartmentStore, has used time-series extrapolation to…
A: Given data
Q: Below is a table containing data on product demand for the most recent three months along with the…
A: Mean Absolute Deviation (MAD) measures the accuracy of the prediction by the absolute value of each…
Q: Use the sales data given below to determine: (a) the least squares trend line, and (b) the predicted…
A: Formulas Used: Mean = Sum of values/ Number of values Equation: y = a + b x where, a = (Mean of y)…
Q: Using the Quarterly Sales Data, Assume there is no trend & Compute the four seasonal index values.…
A: Find the given details below: Given details: Year Quarter 1 2 3 4 1 218 226 232 239 2…
Q: National Scan, Ic., sells radio frequency inventory tags. Monthly sales for a seven-month period…
A: Given data- Month Sales (000) units Feb 13 Mar 16 Apr 10 May 18 Jun 20 Jul 21 Aug…
Q: The Holy Smokes Corporation sells altar candles world-wide. Quarterly sales data for the past 5…
A: Below are the used three standard error measures: mean squared error (MSE), mean absolute percent…
Q: The following table gives the number of pints of type A blood used at Damascus Hospital in the past…
A: Find the Given details below: Given details: Week of Pints Used August 31 360 September 7…
Q: Historical demand for a product is as follows. The sales manager wants to test various forecasting…
A: a) Calculate forecast using three month moving average form April to September. The formula is used…
Q: Construct a time series plot. What type of pattern exists? Develop a…
A: Solution 1. The time series plot is constructed by taking sales data on Y - axis and months on…
Q: The following table shows the past two years of quarterly sales information. Assume that there are…
A:
Q: Sales of Volkswagen's popular Beetle have grown steadily at auto dealerships in Nevada during the…
A: Yt= Value of Current yearFt=Yt-1+Yt-2+Yt-33
Q: Compute the MAD and tracking signal for each period.
A: ANSWER IS AS BELOW:
Q: 2. National Scan, Inc., sells radio frequency inventory tags. Monthly sales for a seven- month…
A: Here, from the question, I have got the tabulated data, for this data, I have applied various…
Q: The following are monthly actual and forecast demand levels for May through December for units of a…
A: Forecast Error = Actual Demand - Forecast Demand Absolute Error = Positive value of Forecast Error
Q: 1. Solve manually. a. Income at the law firm Smith and Wesson for the period February to July was as…
A: Regression is a statistical technique used in finance, investing, and other fields to identify the…
Q: Bradley’s Copiers sells and repairs photocopy machines.The manager needs weekly forecasts of service…
A: Given data, Week Actual Services level 1 29 2 27 3 41 4 18 5 33 Exponential…
Q: Monthly sales in a company for a seven-period (Jan-July) were as follows: 19, 18, 16, 14, 17, 19,…
A: A simple moving average calculates the average of a selected range of the values, usually the closed…
Q: The following equation summarizes the trend portion of quarterly sales of condominiums over a long…
A:
Q: Consider the following actual (At) and forecast(Ft) demand levels for a commercial multiline…
A:
Q: Income at the architectural firm Spraggins and Yunes for the period February to July was as follows:…
A: The formula to be used in Trend smoothing, Tt is Tt+1= Tt + beta*(Ft+1 – FITt)
Q: Below is a table containing data on product demand for the most recent five months along with the…
A: The simple moving average forecasting method considers the latest values of the actual demand of a…
Q: Assume that your stock of sales merchandise is maintained based on the forecast demand. If the…
A: Given data is
Q: Consider the following time series data. 2 3 4 5 6 Week 1 Value 19 12 14 10 16 13 (a) Construct a…
A: 3-period moving average forecast (Ft)= At-1+At-2+At-33 Exponential smoothing Forecast…
Q: Compute the one-step-ahead three-month and six-month moving-average forecastsfor July through…
A: The techniques of forecasting give the complete idea of the trend is known as moving average…
Q: Compute the MAD and tracking signal for each period
A: ANSWER IS AS BELOW:
Q: The figures below show the sales of hairdryers in one shop over the last 3 months. Month 1: 140…
A: Exponential smoothing is a forecasting model which helps to identify the forecasting demand using…
Q: The following table shows quarterly sales (in thousand units) for a product over 4 years. The…
A: Here, I have been given the overall sales average value for the entire four years, The formula for…
Q: c) If the forecasted demand for the week of August 31 is 345 and a = 0.20, using exponential…
A:
Q: Coca Cola in Turkey manages its products' inventory at Shell gas stations, that is Coca Cola,…
A: The bullwhip effect is described as the distortion in demand that occurs due to an incorrect…
Q: Forecasting is a prediction rather than a reality
A: The term forecasting is a technique that uses the historical data as inputs to make the informed…
Q: Income at the architectural firm Spraggins andYunes for the period February to July was as follows:…
A: Foretasted Income at time t Ft= FIT (t−1) +α(A(t−1)−FIT (t−1) ) Trend at time t…
Q: Cell phone sales for a California-based firm over the last 10 weeks are shown in the following…
A: Formula:
Q: is a method that utilizes the principle of using only the last observation in a sequence of stable…
A: ________ is a method that utilizes the principle of using only the last observation in a sequence of…
Q: Two independent methods of forecasting based on judgment and experience have been prepared each…
A: Given data Month Sales Forecast1 Forecast 2 1 770 771 769 2 789 785 787 3 794 790 792…
Q: What type of pattern exists in the data? The time series plot shows an upward linear trend. The time…
A:
Q: A MAD (Mean Absolute Deviation) of 17.3 suggests which of the following? O There is an…
A: Forecast Bias can be defined as a movement to either over-forecast (forecast is more than the…
Q: A newly operated company producing household items would want to forecast its sales volume for the…
A: Find the Given details below: Given Details Month Sales (Quantity) 1 300280 2 290295 3…
Q: The errors in a particular forecast are as follows: 3, -3, 4, 0, -2. What is the tracking signal for…
A: Error = Actual demand - forecast Absolute Error = Positive value of error MAD = average of…
Q: Explain the term Forcasting
A: In getting ready designs for the future, the administration authority needs to make a few…
Q: To better plan for future growth of the restaurant, Karen needs to develop a system that will enable…
A: Forecasting is a method that involves chronicled information as contributions to make informed…
Q: The Victory Plus Mutual Fund of growth stocks has had the following average monthly price for the…
A: Note: - Since we can answer only up to three subparts we will answer the first three(1, 2, and 3)…


Trending now
This is a popular solution!

Step by step
Solved in 2 steps with 2 images

- The file P13_02.xlsx contains five years of monthly data on sales (number of units sold) for a particular company. The company suspects that except for random noise, its sales are growing by a constant percentage each month and will continue to do so for at least the near future. a. Explain briefly whether the plot of the series visually supports the companys suspicion. b. By what percentage are sales increasing each month? c. What is the MAPE for the forecast model in part b? In words, what does it measure? Considering its magnitude, does the model seem to be doing a good job? d. In words, how does the model make forecasts for future months? Specifically, given the forecast value for the last month in the data set, what simple arithmetic could you use to obtain forecasts for the next few months?The Baker Company wants to develop a budget to predict how overhead costs vary with activity levels. Management is trying to decide whether direct labor hours (DLH) or units produced is the better measure of activity for the firm. Monthly data for the preceding 24 months appear in the file P13_40.xlsx. Use regression analysis to determine which measure, DLH or Units (or both), should be used for the budget. How would the regression equation be used to obtain the budget for the firms overhead costs?The file P13_42.xlsx contains monthly data on consumer revolving credit (in millions of dollars) through credit unions. a. Use these data to forecast consumer revolving credit through credit unions for the next 12 months. Do it in two ways. First, fit an exponential trend to the series. Second, use Holts method with optimized smoothing constants. b. Which of these two methods appears to provide the best forecasts? Answer by comparing their MAPE values.
- The file P13_26.xlsx contains the monthly number of airline tickets sold by the CareFree Travel Agency. a. Create a time series chart of the data. Based on what you see, which of the exponential smoothing models do you think will provide the best forecasting model? Why? b. Use simple exponential smoothing to forecast these data, using a smoothing constant of 0.1. c. Repeat part b, but search for the smoothing constant that makes RMSE as small as possible. Does it make much of an improvement over the model in part b?The file P13_28.xlsx contains monthly retail sales of U.S. liquor stores. a. Is seasonality present in these data? If so, characterize the seasonality pattern. b. Use Winters method to forecast this series with smoothing constants = = 0.1 and = 0.3. Does the forecast series seem to track the seasonal pattern well? What are your forecasts for the next 12 months?The file P13_29.xlsx contains monthly time series data for total U.S. retail sales of building materials (which includes retail sales of building materials, hardware and garden supply stores, and mobile home dealers). a. Is seasonality present in these data? If so, characterize the seasonality pattern. b. Use Winters method to forecast this series with smoothing constants = = 0.1 and = 0.3. Does the forecast series seem to track the seasonal pattern well? What are your forecasts for the next 12 months?
- The file P13_19.xlsx contains the weekly sales of a particular brand of paper towels at a supermarket for a one-year period. a. Using a span of 3, forecast the sales of this product for the next 10 weeks with the moving averages method. How well does this method with span 3 forecast the known observations in this series? b. Repeat part a with a span of 10. c. Which of these two spans appears to be more appropriate? Justify your choice.The file P13_25.xlsx contains the quarterly numbers of applications for home mortgage loans at a branch office of Northern Central Bank. a. Create a time series chart of the data. Based on what you see, which of the exponential smoothing models do you think will provide the best forecasting model? Why? b. Use simple exponential smoothing to forecast these data, using a smoothing constant of 0.1. c. Repeat part b, but search for the smoothing constant that makes RMSE as small as possible. Does it make much of an improvement over the model in part b? Is it guaranteed to produce better forecasts for the future?The file P13_27.xlsx contains yearly data on the proportion of Americans under the age of 18 living below the poverty level. a. Create a time series chart of the data. Based on what you see, which of the exponential smoothing models do you think will provide the best forecasting model? Why? b. Use simple exponential smoothing to forecast these data, using a smoothing constant of 0.1. c. Repeat part b, but search for the smoothing constant that makes RMSE as small as possible. Create a chart of the series with the forecasts superimposed from this optimal smoothing constant. Does it make much of an improvement over the model in part b? d. Write a short report to summarize your results. Considering the chart in part c, would you say the forecasts are good?
- Suppose that a regional express delivery service company wants to estimate the cost of shipping a package (Y) as a function of cargo type, where cargo type includes the following possibilities: fragile, semifragile, and durable. Costs for 15 randomly chosen packages of approximately the same weight and same distance shipped, but of different cargo types, are provided in the file P13_16.xlsx. a. Estimate a regression equation using the given sample data, and interpret the estimated regression coefficients. b. According to the estimated regression equation, which cargo type is the most costly to ship? Which cargo type is the least costly to ship? c. How well does the estimated equation fit the given sample data? How might the fit be improved? d. Given the estimated regression equation, predict the cost of shipping a package with semifragile cargo.The file P13_20.xlsx contains the monthly sales of iPod cases at an electronics store for a two-year period. Use the moving averages method, with spans of your choice, to forecast sales for the next six months. Does this method appear to track sales well? If not, what might be the reason?A small computer chip manufacturer wants to forecast monthly ozperating costs as a function of the number of units produced during a month. The company has collected the 16 months of data in the file P13_34.xlsx. a. Determine an equation that can be used to predict monthly production costs from units produced. Are there any outliers? b. How could the regression line obtained in part a be used to determine whether the company was efficient or inefficient during any particular month?