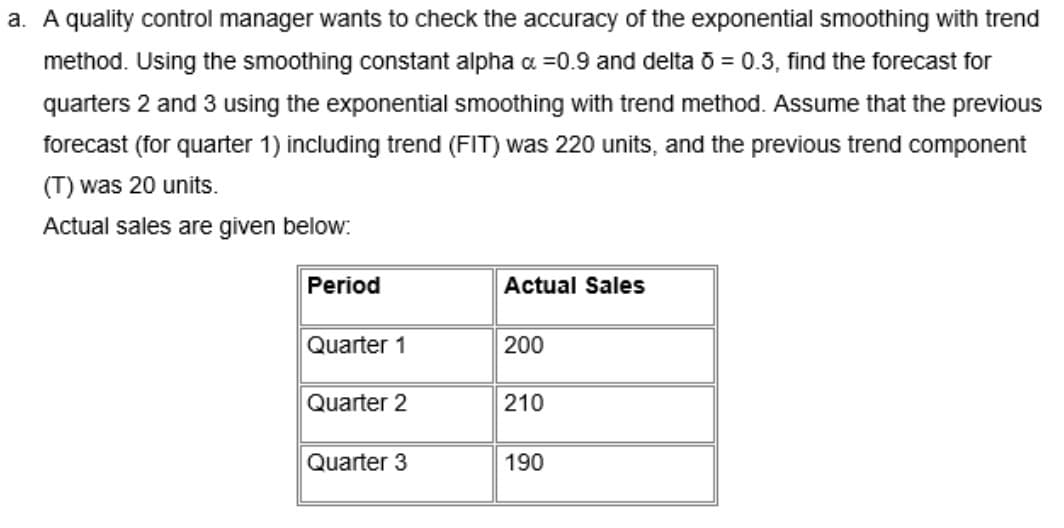
A quality control manager wants to check the accuracy of the exponential smoothing with trend method. Using the smoothing constant alpha a =0.9 and delta õ = 0.3, find the forecast for quarters 2 and 3 using the exponential smoothing with trend method. Assume that the previous forecast (for quarter 1) including trend (FIT) was 220 units, and the previous trend component (T) was 20 units. Actual sales are given below: Period Actual Sales Quarter 1 200 Quarter 2 210 Quarter 3 190
Q: Series forecasting for Business| The F-test used in testing the significance of a regression model…
A: The correct answer is
Q: Week Actual Forecast Demand 1 52 48 2 42 46 3 56 52 4 45 47 true or false Assume that the actual…
A: The table shows the calculation of forecast of demand using the simple moving average method with 3…
Q: which of the following is a technique used to determine forecasting accuracy A. Mean Absolute…
A: There is a difference between forecasting and finding the accuracy of the forecast and one might…
Q: The table below shows the demand for a particular brand of microwave oven in a department store.…
A: Given-
Q: Consider the following time series data. Week 1 2 3 4 5 6 Value 18 13 16 11 17 14 a. Construct a…
A: Given information Week Value 1 18 2 13 3 16 4 11 5 17 6 14
Q: Sales for the past 6 months at Computer Success are given here. Month Sales $ January 150 February…
A: Given data is
Q: In exponential smoothing, if ɑ = 0.3, then the damping factor for use in forecasting should be: *…
A: Exponential smoothing is a forecasting method which identify the forecasting value using the…
Q: Using the data set below, what would be the forecast for period 5 using the exponential smoothing…
A: Forecasting is the process of estimating future sales or demand using previous data and information.…
Q: Sales of Volkswagen's popular Beetle have grown steadily at auto dealerships in Nevada during the…
A: When α=0.30 Period Sales Forecasted Sales Actual - Forecast 2005 455 415 40 2006 510 427 83…
Q: d) Calculate the trend projection with regression forecast for periods 7 through 10. The regression…
A: Forecasting is the ability to predict future happenings using different forecasting methods.
Q: The following equation summarizes the trend portion of quarterly sales of condominiums over a long…
A: Forecasting is a method that produces accurate estimates using historical data as inputs to…
Q: 2. National Scan, Inc., sells radio frequency inventory tags. Monthly sales for a seven- month…
A: Here, from the question, I have got the tabulated data, for this data, I have applied various…
Q: Construct a time series plot. What type of pattern exists in the data? a. Develop the three-week…
A: There are various methods to forecast demand/sales like the moving averages method, exponential…
Q: Forecasts based on averages. Given the following data:PeriodNumber ofComplaints1 602 653 554 585…
A: Formula: Answer:
Q: Given that the previous forecast of 65 turnedout to be four units less than the actual demand; the…
A: In simple exponential smoothing method, forecast for period t can be calculated using the following…
Q: Income at the architectural firm Spraggins and Yunes for the period February to July was as follows:…
A: The formula to be used in Trend smoothing, Tt is Tt+1= Tt + beta*(Ft+1 – FITt)
Q: The following is the Forecasting model for a FOUR season product; the model has been in use since…
A: Regression Analysis Method: The advantage of regression analysis is that it does not consider only…
Q: A production company was able to hit the following sales order for the past 3 months: 45% of 420pcs…
A: Given data is
Q: Sales of Volkswagen's popular Beetle have grown steadily at auto dealerships in Nevada during the…
A: Given that: Year Sales Forecasted Sales 2005 455 415 2006 510 427 2007 516 451.9 2008 570…
Q: Below is a table containing data on product demand for the most recent five months along with the…
A: The simple moving average forecasting method considers the latest values of the actual demand of a…
Q: Sales of Volkswagen's popular Beetle have grown steadily at auto dealerships in Nevada during the…
A: MAD(Mean Absolute Deviation) = Sum of absolute deviations/Number of periods
Q: National Standard, Inc. sells radio frequency identification (RFID) tags. Monthly demand for a…
A: Note: - Since we only answer up to 3 sub-parts, we’ll answer the first3. Please resubmit the…
Q: Consider the following from an estate agent’s business nationally: Month Houses Sold Jan 380…
A: Since you have submitted multiple questions, as per guidelines I have answered the first question…
Q: c. Using simple exponential smoothing, what would your forecast be for this month if the…
A:
Q: Ordinary least squares technique or linear regression analysis
A: THE ANSWER IS AS BELOW:
Q: Briefly mention the five characteristics of data patterns in time series method of forecasting.
A: Time series forecasting happens when making a scientific projection based on documented or…
Q: Suppose actual quarterly sales (in thousands) for Year 5 are 193, 163, 207, and 105 respectively.…
A:
Q: Use the data below to solve for the following: Naïve method Unweighted 3 month moving average…
A: Note: - Since we can answer up to three subparts only, we will answer the first three subparts(first…
Q: Consider the following sales data for Bell, Inc. Month Sales ($ Millions) Jan. 10 Feb. 12 March…
A: Weighted moving average M - M=∑i=nWt ×Vt∑i=nWt Where M = Moving Average Value V= Actual value W…
Q: 1. What is the tracking signal for the forecast?
A: Forecasting is the process of predicting future demand according to the previous information or…
Q: Air travel on Mountain Airlines for the past 18 weeks was:Week Passengers1 4052 4103 4204 4155 4126…
A: a) The moving average technique would not be appropriate for the given data because the data is…
Q: Your manager is trying to determine what forecasting method to use. Based upon the following…
A: In exponential smoothing, the smoothing constant is used to forecast the demand for the next period…
Q: The following data are for calculator sales in units at an electronics store over the past nine…
A: Given Sales data-
Q: Here are the data for the past 21 months for actual sales of a particular product: LAST YEAR THIS…
A: Given: Weight for the recent quarter or (3rd quarter) = 0.50 Second most recent or (2nd quarter) =…
Q: a) Use a 2-month moving average on all the data and plot the averages and the prices. b) Use a…
A: The mean absolute deviation(MAD) shows the errors in the forecasted values from the actual values.…
Q: Handy, Inc., produces a solar-powered electronic calculator that has experienced the following…
A: All the sales value in thousands So to calculate the forecasted May month sales the formula we put…
Q: 2. Simple moving average using Excel: Calculate demand forecast for weeks 6-20 using 5 week simple…
A: Forecasting is predicting the demand/sales in advance for future periods. Moving average forecast is…
Q: Two independent methods of forecasting based on judgment and experience have been prepared each…
A: Given data Month Sales Forecast1 Forecast 2 1 770 771 769 2 789 785 787 3 794 790 792…
Q: An analyst must decide between two different forecasting techniques for weekly sales of roller…
A: MAD stands for mean absolute deviation. Whereas, MSE stands for mean squared error. These are the…
Q: You manager gave you February 2021 actual sales and sales forecast. This is the only raw data you…
A: A business estimate might be a forecast of future deals income. Deals conjectures are normally…
Q: None of the options are correct.
A: What is Stationarity? A time collection has stationarity if a shift in time doesn’t purpose an…
Q: Describe why such forecasting devices as moving average , weighted averages and exponential…
A: To be determined: why such forecasting devices as moving average , weighted averages and…
Q: The following data are for calculator sales in units at an electronicsstore over the past 9…
A: In order to find Trend projection, Trend equation using regression is as follows: Where, and…
Q: Gasoline sales Times Series week sales (1000s of gallons 1 17 2 21 3 19 4 23 5 18 6…
A: Formula:
Q: An analyst must decide between two different forecasting techniques for weekly sales of…
A:
Q: Use the following information to compute a single exponential smoothing model forecast with a…
A: From the above information, Let, Forecast for period 1 =f1 =115 Actual value for period 1 =a1…
Q: A company which installs swimming pools has recently merged with another regional installer. It is…
A: Forecasting in advance helps to estimate the sales that could be generated in the future period.…
Q: Simple moving average, Weighted moving average, Simple Exponential Smoothing, Regression. Choose two…
A: Since you have posted a question with multiple sub-parts, we will solve the first three sub-parts…
Q: Sales of Volkswagen's popular Beetle have grown steadily at auto dealerships in Nevada during the…
A:
Trending now
This is a popular solution!
Step by step
Solved in 2 steps with 2 images
- Under what conditions might a firm use multiple forecasting methods?The file P13_42.xlsx contains monthly data on consumer revolving credit (in millions of dollars) through credit unions. a. Use these data to forecast consumer revolving credit through credit unions for the next 12 months. Do it in two ways. First, fit an exponential trend to the series. Second, use Holts method with optimized smoothing constants. b. Which of these two methods appears to provide the best forecasts? Answer by comparing their MAPE values.The Baker Company wants to develop a budget to predict how overhead costs vary with activity levels. Management is trying to decide whether direct labor hours (DLH) or units produced is the better measure of activity for the firm. Monthly data for the preceding 24 months appear in the file P13_40.xlsx. Use regression analysis to determine which measure, DLH or Units (or both), should be used for the budget. How would the regression equation be used to obtain the budget for the firms overhead costs?
- The file P13_22.xlsx contains total monthly U.S. retail sales data. While holding out the final six months of observations for validation purposes, use the method of moving averages with a carefully chosen span to forecast U.S. retail sales in the next year. Comment on the performance of your model. What makes this time series more challenging to forecast?The owner of a restaurant in Bloomington, Indiana, has recorded sales data for the past 19 years. He has also recorded data on potentially relevant variables. The data are listed in the file P13_17.xlsx. a. Estimate a simple regression equation involving annual sales (the dependent variable) and the size of the population residing within 10 miles of the restaurant (the explanatory variable). Interpret R-square for this regression. b. Add another explanatory variableannual advertising expendituresto the regression equation in part a. Estimate and interpret this expanded equation. How does the R-square value for this multiple regression equation compare to that of the simple regression equation estimated in part a? Explain any difference between the two R-square values. How can you use the adjusted R-squares for a comparison of the two equations? c. Add one more explanatory variable to the multiple regression equation estimated in part b. In particular, estimate and interpret the coefficients of a multiple regression equation that includes the previous years advertising expenditure. How does the inclusion of this third explanatory variable affect the R-square, compared to the corresponding values for the equation of part b? Explain any changes in this value. What does the adjusted R-square for the new equation tell you?The file P13_26.xlsx contains the monthly number of airline tickets sold by the CareFree Travel Agency. a. Create a time series chart of the data. Based on what you see, which of the exponential smoothing models do you think will provide the best forecasting model? Why? b. Use simple exponential smoothing to forecast these data, using a smoothing constant of 0.1. c. Repeat part b, but search for the smoothing constant that makes RMSE as small as possible. Does it make much of an improvement over the model in part b?
- The file P13_02.xlsx contains five years of monthly data on sales (number of units sold) for a particular company. The company suspects that except for random noise, its sales are growing by a constant percentage each month and will continue to do so for at least the near future. a. Explain briefly whether the plot of the series visually supports the companys suspicion. b. By what percentage are sales increasing each month? c. What is the MAPE for the forecast model in part b? In words, what does it measure? Considering its magnitude, does the model seem to be doing a good job? d. In words, how does the model make forecasts for future months? Specifically, given the forecast value for the last month in the data set, what simple arithmetic could you use to obtain forecasts for the next few months?The file P13_29.xlsx contains monthly time series data for total U.S. retail sales of building materials (which includes retail sales of building materials, hardware and garden supply stores, and mobile home dealers). a. Is seasonality present in these data? If so, characterize the seasonality pattern. b. Use Winters method to forecast this series with smoothing constants = = 0.1 and = 0.3. Does the forecast series seem to track the seasonal pattern well? What are your forecasts for the next 12 months?The file P13_28.xlsx contains monthly retail sales of U.S. liquor stores. a. Is seasonality present in these data? If so, characterize the seasonality pattern. b. Use Winters method to forecast this series with smoothing constants = = 0.1 and = 0.3. Does the forecast series seem to track the seasonal pattern well? What are your forecasts for the next 12 months?
- The file P13_25.xlsx contains the quarterly numbers of applications for home mortgage loans at a branch office of Northern Central Bank. a. Create a time series chart of the data. Based on what you see, which of the exponential smoothing models do you think will provide the best forecasting model? Why? b. Use simple exponential smoothing to forecast these data, using a smoothing constant of 0.1. c. Repeat part b, but search for the smoothing constant that makes RMSE as small as possible. Does it make much of an improvement over the model in part b? Is it guaranteed to produce better forecasts for the future?Do the sales prices of houses in a given community vary systematically with their sizes (as measured in square feet)? Answer this question by estimating a simple regression equation where the sales price of the house is the dependent variable, and the size of the house is the explanatory variable. Use the sample data given in P13_06.xlsx. Interpret your estimated equation, the associated R-square value, and the associated standard error of estimate.A small computer chip manufacturer wants to forecast monthly ozperating costs as a function of the number of units produced during a month. The company has collected the 16 months of data in the file P13_34.xlsx. a. Determine an equation that can be used to predict monthly production costs from units produced. Are there any outliers? b. How could the regression line obtained in part a be used to determine whether the company was efficient or inefficient during any particular month?