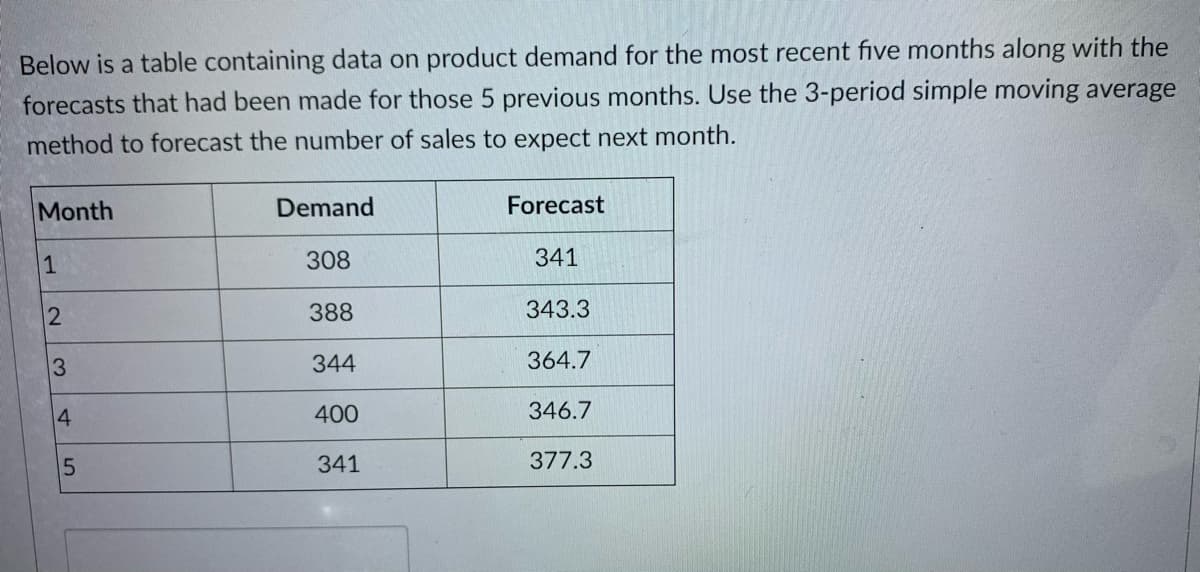
Below is a table containing data on product demand for the most recent five months along with the forecasts that had been made for those 5 previous months. Use the 3-period simple moving average method to forecast the number of sales to expect next month. Month Demand Forecast 1 308 341 388 343.3 344 364.7 400 346.7 341 377.3
Below is a table containing data on product demand for the most recent five months along with the forecasts that had been made for those 5 previous months. Use the 3-period simple moving average method to forecast the number of sales to expect next month. Month Demand Forecast 1 308 341 388 343.3 344 364.7 400 346.7 341 377.3

Practical Management Science
6th Edition
ISBN:9781337406659
Author:WINSTON, Wayne L.
Publisher:WINSTON, Wayne L.
Chapter13: Regression And Forecasting Models
Section13.6: Moving Averages Models
Problem 19P: The file P13_19.xlsx contains the weekly sales of a particular brand of paper towels at a...

Related questions

Question
Transcribed Image Text:Below is a table containing data on product demand for the most recent five months along with the
forecasts that had been made for those 5 previous months. Use the 3-period simple moving average
method to forecast the number of sales to expect next month.
Month
Demand
Forecast
1
308
341
388
343.3
3
344
364.7
4
400
346.7
341
377.3
Expert Solution
This question has been solved!
Explore an expertly crafted, step-by-step solution for a thorough understanding of key concepts.

Step by step
Solved in 2 steps

Knowledge Booster


Learn more about
Need a deep-dive on the concept behind this application? Look no further. Learn more about this topic, operations-management and related others by exploring similar questions and additional content below.Recommended textbooks for you
Practical Management Science
Operations Management
ISBN:
9781337406659
Author:
WINSTON, Wayne L.
Publisher:
Cengage,
Practical Management Science
Operations Management
ISBN:
9781337406659
Author:
WINSTON, Wayne L.
Publisher:
Cengage,