National Scan, Ic., sells radio frequency inventory tags. Monthly sales for a seven-month period were as follows: Sales Month (000)Units 13 16 Feb. Mar. Apr. 10 Мay. 18 Jun. 20 Jul. 21 Aug. 25 Click here for the Excel Data File a. Forecast September sales volume using each of the following: (1) The naive approach. Naive approach thousands (2) A five-month moving average. (Round your answer to 2 decimal places.) Moving average thousands
National Scan, Ic., sells radio frequency inventory tags. Monthly sales for a seven-month period were as follows: Sales Month (000)Units 13 16 Feb. Mar. Apr. 10 Мay. 18 Jun. 20 Jul. 21 Aug. 25 Click here for the Excel Data File a. Forecast September sales volume using each of the following: (1) The naive approach. Naive approach thousands (2) A five-month moving average. (Round your answer to 2 decimal places.) Moving average thousands

Practical Management Science
6th Edition
ISBN:9781337406659
Author:WINSTON, Wayne L.
Publisher:WINSTON, Wayne L.
Chapter13: Regression And Forecasting Models
Section13.7: Exponential Smoothing Models
Problem 26P: The file P13_26.xlsx contains the monthly number of airline tickets sold by the CareFree Travel...

Related questions
Question
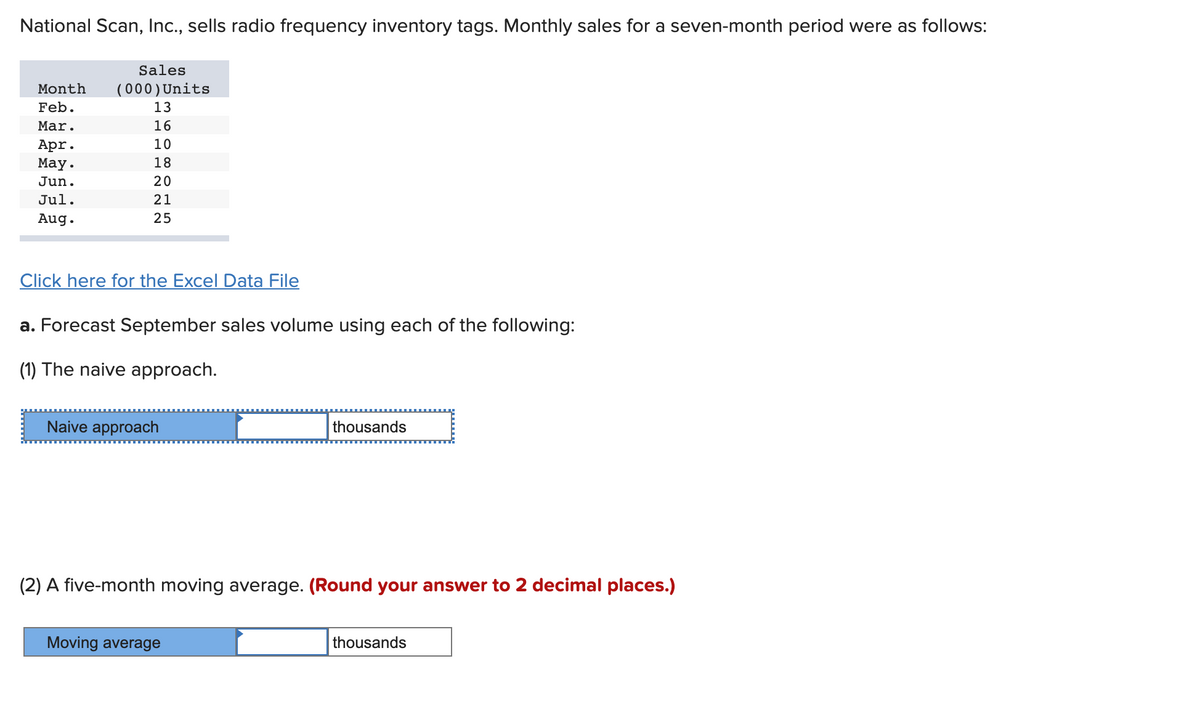
Transcribed Image Text:National Scan, Inc., sells radio frequency inventory tags. Monthly sales for a seven-month period were as follows:
IT
Sales
Month
(000)Units
Feb.
13
Mar.
16
10
Apr.
Маy.
18
Jun.
20
Jul.
21
Aug.
25
Click here for the Excel Data File
a. Forecast September sales volume using each of the following:
(1) The naive approach.
Naive approach
thousands
(2) A five-month moving average. (Round your answer to 2 decimal places.)
Moving average
thousands
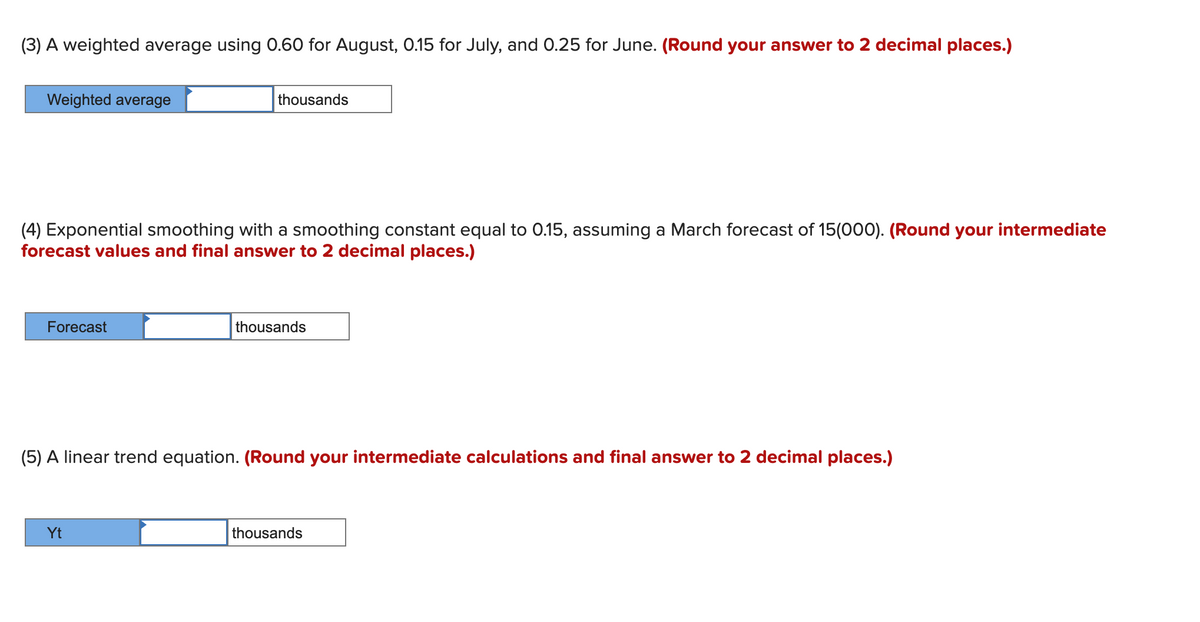
Transcribed Image Text:(3) A weighted average using 0.60 for August, 0.15 for July, and 0.25 for June. (Round your answer to 2 decimal places.)
Weighted average
thousands
(4) Exponential smoothing with a smoothing constant equal to 0.15, assuming a March forecast of 15(000). (Round your intermediate
forecast values and final answer to 2 decimal places.)
Forecast
thousands
(5) A linear trend equation. (Round your intermediate calculations and final answer to 2 decimal places.)
Yt
thousands
Expert Solution
This question has been solved!
Explore an expertly crafted, step-by-step solution for a thorough understanding of key concepts.

This is a popular solution!

Trending now
This is a popular solution!

Step by step
Solved in 2 steps

Follow-up Questions
Read through expert solutions to related follow-up questions below.
Follow-up Question

Transcribed Image Text:(3) A weighted average using 0.60 for August, 0.15 for July, and 0.25 for June. (Round your answer to 2 decimal places.)
Weighted average
(4) Exponential smoothing with a smoothing constant equal to 0.15, assuming a March forecast of 15(000). (Round your intermediate
forecast values and final answer to 2 decimal places.)
Forecast
thousands
Yt
thousands
(5) A linear trend equation. (Round your intermediate calculations and final answer to 2 decimal places.)
thousands
Solution
Recommended textbooks for you
Practical Management Science
Operations Management
ISBN:
9781337406659
Author:
WINSTON, Wayne L.
Publisher:
Cengage,
Practical Management Science
Operations Management
ISBN:
9781337406659
Author:
WINSTON, Wayne L.
Publisher:
Cengage,