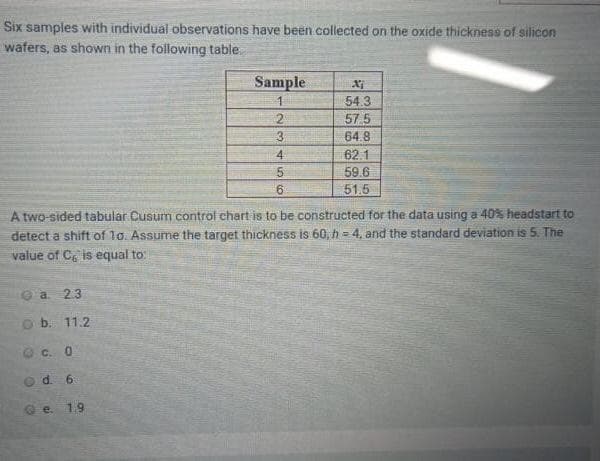
Six samples with individual observations have been collected on the oxide thickness of silicon wafers, as shown in the following table Sample 54.3 21 57.5 3 64.8 4. 62.1 5. 59.6 51.5
Six samples with individual observations have been collected on the oxide thickness of silicon wafers, as shown in the following table Sample 54.3 21 57.5 3 64.8 4. 62.1 5. 59.6 51.5

MATLAB: An Introduction with Applications
6th Edition
ISBN:9781119256830
Author:Amos Gilat
Publisher:Amos Gilat
Chapter1: Starting With Matlab
Section: Chapter Questions
Problem 1P

Related questions

Concept explainers
Contingency Table
A contingency table can be defined as the visual representation of the relationship between two or more categorical variables that can be evaluated and registered. It is a categorical version of the scatterplot, which is used to investigate the linear relationship between two variables. A contingency table is indeed a type of frequency distribution table that displays two variables at the same time.
Binomial Distribution
Binomial is an algebraic expression of the sum or the difference of two terms. Before knowing about binomial distribution, we must know about the binomial theorem.
Topic Video
Question
6
Transcribed Image Text:Six samples with individual observations have been collected on the oxide thickness of silicon
wafers, as shown in the following table
Sample
54.3
57 5
3
64.8
4
62.1
5.
59.6
6.
51.5
A two-sided tabular Cusum control chart is to be constructed for the data using a 40% headstart to
detect a shift of lo. Assume the target thickness is 60, h = 4, and the standard deviation is 5. The
value of Ce is equal to
Oa 23
b. 11.2
C. 0
d. 6
e. 1.9
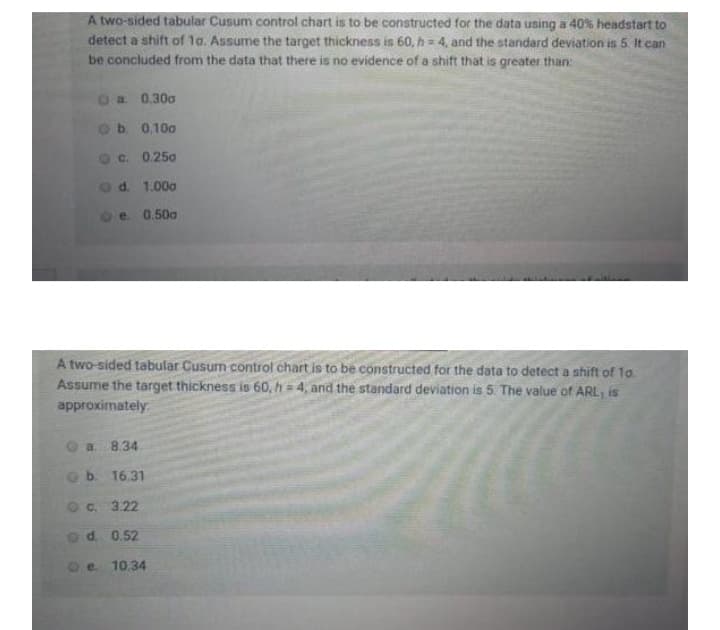
Transcribed Image Text:A two-sided tabular Cusum control chart is to be constructed for the data using a 40% headstart to
detect a shift of 1a. Assume the target thickness is 60, h = 4, and the standard deviation is 5. It can
be concluded from the data that there is no evidence of a shift that is greater than:
a 0.30a
Ob 0.100
oc 0.250
od. 1.000
e. 0.50a
A two-sided tabular Cusum control chart is to be constructed for the data to detect a shift of 1a.
Assume the target thickness is 60, h = 4, and the standard deviation is 5. The value of ARL, is
approximately
a 8.34
b. 16.31
C. 3.22
od. 0.52
e 10,34
Expert Solution
This question has been solved!
Explore an expertly crafted, step-by-step solution for a thorough understanding of key concepts.

Step by step
Solved in 3 steps with 1 images

Knowledge Booster


Learn more about
Need a deep-dive on the concept behind this application? Look no further. Learn more about this topic, statistics and related others by exploring similar questions and additional content below.Recommended textbooks for you
MATLAB: An Introduction with Applications
Statistics
ISBN:
9781119256830
Author:
Amos Gilat
Publisher:
John Wiley & Sons Inc

Probability and Statistics for Engineering and th…
Statistics
ISBN:
9781305251809
Author:
Jay L. Devore
Publisher:
Cengage Learning

Statistics for The Behavioral Sciences (MindTap C…
Statistics
ISBN:
9781305504912
Author:
Frederick J Gravetter, Larry B. Wallnau
Publisher:
Cengage Learning
MATLAB: An Introduction with Applications
Statistics
ISBN:
9781119256830
Author:
Amos Gilat
Publisher:
John Wiley & Sons Inc
Probability and Statistics for Engineering and th…
Statistics
ISBN:
9781305251809
Author:
Jay L. Devore
Publisher:
Cengage Learning
Statistics for The Behavioral Sciences (MindTap C…
Statistics
ISBN:
9781305504912
Author:
Frederick J Gravetter, Larry B. Wallnau
Publisher:
Cengage Learning

Elementary Statistics: Picturing the World (7th E…
Statistics
ISBN:
9780134683416
Author:
Ron Larson, Betsy Farber
Publisher:
PEARSON

The Basic Practice of Statistics
Statistics
ISBN:
9781319042578
Author:
David S. Moore, William I. Notz, Michael A. Fligner
Publisher:
W. H. Freeman

Introduction to the Practice of Statistics
Statistics
ISBN:
9781319013387
Author:
David S. Moore, George P. McCabe, Bruce A. Craig
Publisher:
W. H. Freeman