The Periodic Table is named after the periodicity or repeating rise and fall of certain attributes. Figure 2.3 shows what periodic trend? What periodic trend is shown in Figure 2.4?
The Periodic Table is named after the periodicity or repeating rise and fall of certain attributes. Figure 2.3 shows what periodic trend? What periodic trend is shown in Figure 2.4?

Living By Chemistry: First Edition Textbook
1st Edition
ISBN:9781559539418
Author:Angelica Stacy
Publisher:Angelica Stacy
ChapterU1: Alchemy: Matter, Atomic Structure, And Bonding
SectionU1.10: Breaking The Code: The Periodic Table
Problem 3E

Related questions
Question
- The Periodic Table is named after the periodicity or repeating rise and fall of certain attributes. Figure 2.3 shows what periodic trend? What periodic trend is shown in Figure 2.4?
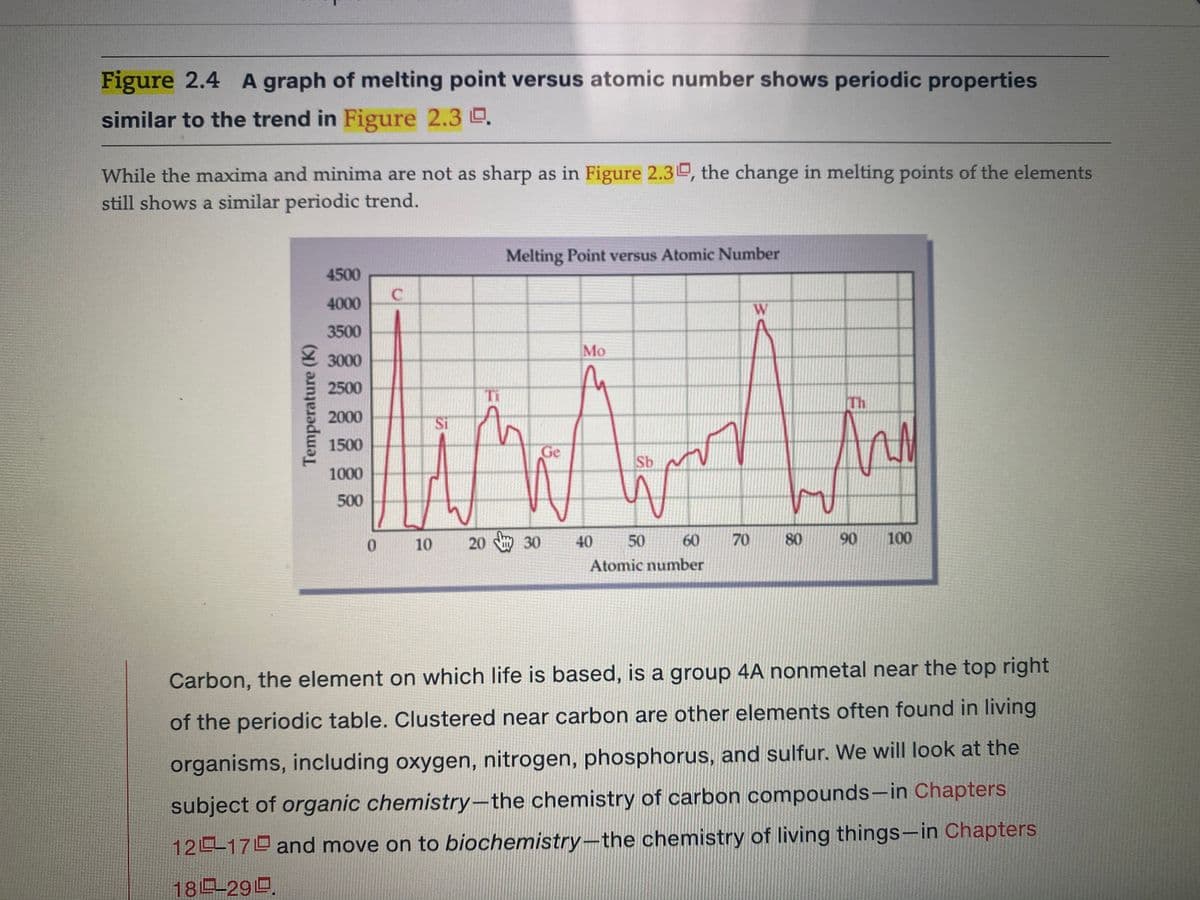
Transcribed Image Text:Figure 2.4 A graph of melting point versus atomic number shows periodic properties
similar to the trend in Figure 2.3 D.
While the maxima and minima are not as sharp as in Figure 2.3O, the change in melting points of the elements
still shows a similar periodic trend.
Melting Point versus Atomic Number
4500
4000
W
3500
Mo
E 3000
2500
Ti
Th
2000
Si
1500
Ge
Sb
1000
500
0.
10
20 30
40
50
60
70
80
90
100
Atomic number
Carbon, the element on which life is based, is a group 4A nonmetal near the top right
of the periodic table. Clustered near carbon are other elements often found in living
organisms, including oxygen, nitrogen, phosphorus, and sulfur. We will look at the
subject of organic chemistry-the chemistry of carbon compounds-in Chapters
12 17 and move on to biochemistry-the chemistry of living things-in Chapters
18 290.
Temperature (K)
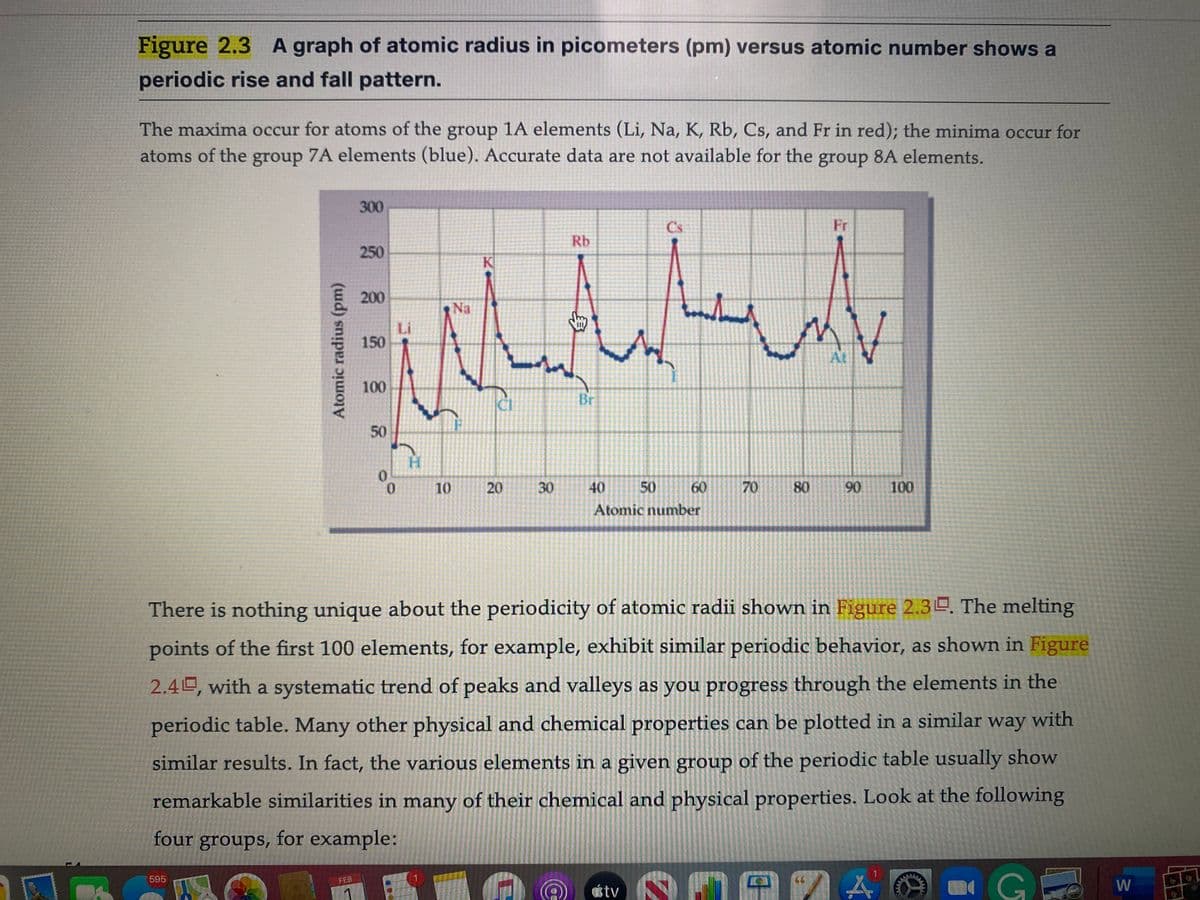
Transcribed Image Text:Figure 2.3 A graph of atomic radius in picometers (pm) versus atomic number shows a
periodic rise and fall pattern.
The maxima occur for atoms of the group 1A elements (Li, Na, K, Rb, Cs, and Fr in red); the minima occur for
atoms of the group 7A elements (blue). Accurate data are not available for the group 8A elements.
300
Cs
Fr
Rb
250
K
200
Na
Li
150
At
100
Br
50
0.
0.
90
10
20
30
40
50
60
70
80
100
Atomic number
There is nothing unique about the periodicity of atomic radii shown in Figure 2.3 . The melting
points of the first 100 elements, for example, exhibit similar periodic behavior, as shown in Figure
2.4 , with a systematic trend of peaks and valleys as you progress through the elements in the
periodic table. Many other physical and chemical properties can be plotted in a similar way with
similar results. In fact, the various elements in a given group of the periodic table usually show
remarkable similarities in many of their chemical and physical properties. Look at the following
four groups, for example:
G
595
FEB
CC
étv
W
Atomic radius (pm)
Expert Solution
This question has been solved!
Explore an expertly crafted, step-by-step solution for a thorough understanding of key concepts.

This is a popular solution!

Trending now
This is a popular solution!

Step by step
Solved in 2 steps

Knowledge Booster


Learn more about
Need a deep-dive on the concept behind this application? Look no further. Learn more about this topic, chemistry and related others by exploring similar questions and additional content below.Recommended textbooks for you
Living By Chemistry: First Edition Textbook
Chemistry
ISBN:
9781559539418
Author:
Angelica Stacy
Publisher:
MAC HIGHER

Introductory Chemistry: An Active Learning Approa…
Chemistry
ISBN:
9781305079250
Author:
Mark S. Cracolice, Ed Peters
Publisher:
Cengage Learning

Chemistry: Matter and Change
Chemistry
ISBN:
9780078746376
Author:
Dinah Zike, Laurel Dingrando, Nicholas Hainen, Cheryl Wistrom
Publisher:
Glencoe/McGraw-Hill School Pub Co
Living By Chemistry: First Edition Textbook
Chemistry
ISBN:
9781559539418
Author:
Angelica Stacy
Publisher:
MAC HIGHER
Introductory Chemistry: An Active Learning Approa…
Chemistry
ISBN:
9781305079250
Author:
Mark S. Cracolice, Ed Peters
Publisher:
Cengage Learning
Chemistry: Matter and Change
Chemistry
ISBN:
9780078746376
Author:
Dinah Zike, Laurel Dingrando, Nicholas Hainen, Cheryl Wistrom
Publisher:
Glencoe/McGraw-Hill School Pub Co

Introductory Chemistry: A Foundation
Chemistry
ISBN:
9781337399425
Author:
Steven S. Zumdahl, Donald J. DeCoste
Publisher:
Cengage Learning

Chemistry by OpenStax (2015-05-04)
Chemistry
ISBN:
9781938168390
Author:
Klaus Theopold, Richard H Langley, Paul Flowers, William R. Robinson, Mark Blaser
Publisher:
OpenStax

Chemistry for Engineering Students
Chemistry
ISBN:
9781337398909
Author:
Lawrence S. Brown, Tom Holme
Publisher:
Cengage Learning