the regression equation, letting overhead width be the predictor (x) variable. Find the best predicted weight of a seal if the overhead width measured from a tograph is 1.7 cm. Can the prediction be correct? What is wrong with predicting the weight in this case? Use a significance level of 0.05. 8.4 175 7.8 180 9.8 258 regression equation is y=+x. und to one decimal place as needed.) 7.2 124 9.3 233 erhead Width (cm) ght (kg) Click the icon to view the critical values of the Pearson correlation coefficient r. 9.1 231 ... e best predicted weight for an overhead width of 1.7 cm is kg. und to one decimal place as needed.) n the prediction be correct? What is wrong with predicting the weight in this case? A. The prediction cannot be correct because there is not sufficient evidence of a linear correlation. The width in this case is beyond the scope of the available sample da B. The prediction cannot be correct because a negative weight does not make sense and because there is not sufficient evidence of a linear correlation. C. The prediction cannot be correct because a negative weight does not make sense. The width in this case is beyond the scope of the available sample data. D. The prediction can be correct. There is nothing wrong with predicting the weight in this case.
the regression equation, letting overhead width be the predictor (x) variable. Find the best predicted weight of a seal if the overhead width measured from a tograph is 1.7 cm. Can the prediction be correct? What is wrong with predicting the weight in this case? Use a significance level of 0.05. 8.4 175 7.8 180 9.8 258 regression equation is y=+x. und to one decimal place as needed.) 7.2 124 9.3 233 erhead Width (cm) ght (kg) Click the icon to view the critical values of the Pearson correlation coefficient r. 9.1 231 ... e best predicted weight for an overhead width of 1.7 cm is kg. und to one decimal place as needed.) n the prediction be correct? What is wrong with predicting the weight in this case? A. The prediction cannot be correct because there is not sufficient evidence of a linear correlation. The width in this case is beyond the scope of the available sample da B. The prediction cannot be correct because a negative weight does not make sense and because there is not sufficient evidence of a linear correlation. C. The prediction cannot be correct because a negative weight does not make sense. The width in this case is beyond the scope of the available sample data. D. The prediction can be correct. There is nothing wrong with predicting the weight in this case.

College Algebra
7th Edition
ISBN:9781305115545
Author:James Stewart, Lothar Redlin, Saleem Watson
Publisher:James Stewart, Lothar Redlin, Saleem Watson
Chapter1: Equations And Graphs
Section: Chapter Questions
Problem 10T: Olympic Pole Vault The graph in Figure 7 indicates that in recent years the winning Olympic men’s...

Related questions
Question
3
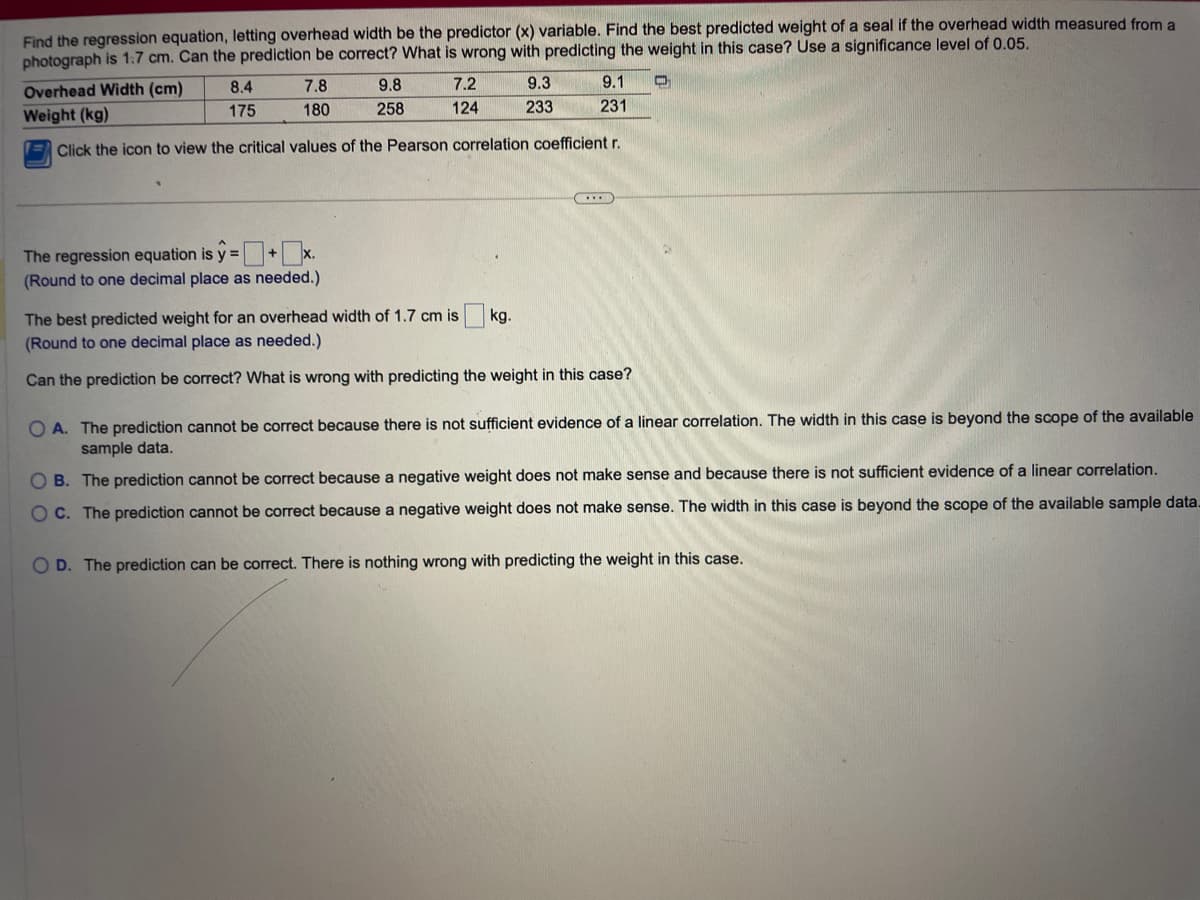
Transcribed Image Text:Find the regression equation, letting overhead width be the predictor (x) variable. Find the best predicted weight of a seal if the overhead width measured from a
photograph is 1.7 cm. Can the prediction be correct? What is wrong with predicting the weight in this case? Use a significance level of 0.05.
D
8.4
175
9.8
258
The regression equation is y=+x.
(Round to one decimal place as needed.)
7.2
124
Overhead Width (cm)
7.8
9.1
Weight (kg)
180
231
=Click the icon to view the critical values of the Pearson correlation coefficient r.
9.3
233
kg.
(...)
The best predicted weight for an overhead width of 1.7 cm is
(Round to one decimal place as needed.)
Can the prediction be correct? What is wrong with predicting the weight in this case?
OA. The prediction cannot be correct because there is not sufficient evidence of a linear correlation. The width in this case is beyond the scope of the available
sample data.
OB. The prediction cannot be correct because a negative weight does not make sense and because there is not sufficient evidence of a linear correlation.
OC. The prediction cannot be correct because a negative weight does not make sense. The width in this case is beyond the scope of the available sample data.
OD. The prediction can be correct. There is nothing wrong with predicting the weight in this case.

Transcribed Image Text:F4567
8
19
10
11
12
13
14
15
16
17
18
19
20
25
30
35
40
45
50
60
70
80
90
100
n
Critical Values of the Pearson Correlation Coefficient r
x=0.05
x=0.01
0.950
0.878
0.811
0.754
0.707
0.666
0.632
0.602
0.576
0.553
0.532
0.514
0.497
0.482
0.468
0.456
0.444
0.396
0.361
0.335
0.312
0.294
0.279
0.254
0.236
0.220
0.207
0.196
x=0.05
0.990
0.959
0.917
0.875
0.834
0.798
0.765
0.735
0.708
0.684
0.661
0.641
0.623
0.606
0.590
0.575
0.561
0.505
0.463
0.430
0.402
0.378
0.361
0.330
0.305
0.286
0.269
0.256
x=0.01
NOTE: To test Ho: p=0
against H₁: p#0, reject Ho
if the absolute value of r is
greater than the critical
value in the table.
his case
ufficient e
eyond the
Expert Solution
This question has been solved!
Explore an expertly crafted, step-by-step solution for a thorough understanding of key concepts.

Step by step
Solved in 4 steps with 3 images

Recommended textbooks for you
College Algebra
Algebra
ISBN:
9781305115545
Author:
James Stewart, Lothar Redlin, Saleem Watson
Publisher:
Cengage Learning
College Algebra
Algebra
ISBN:
9781305115545
Author:
James Stewart, Lothar Redlin, Saleem Watson
Publisher:
Cengage Learning