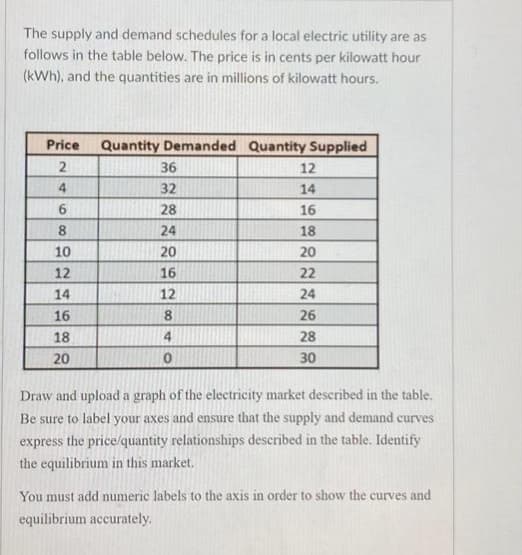
The supply and demand schedules for a local electric utility are as follows in the table below. The price is in cents per kilowatt hour (kWh), and the quantities are in millions of kilowatt hours. Price Quantity Demanded Quantity Supplied 2 4 6 8 10 12 14 16 18 20 36 32 28 24 20 16 12 8 4 0 12 14 16 18 20 22 24 26 28 30 Draw and upload a graph of the electricity market described in the table. Be sure to label your axes and ensure that the supply and demand curves express the price/quantity relationships described in the table. Identify the equilibrium in this market. You must add numeric labels to the axis in order to show the curves and equilibrium accurately.
The supply and demand schedules for a local electric utility are as follows in the table below. The price is in cents per kilowatt hour (kWh), and the quantities are in millions of kilowatt hours. Price Quantity Demanded Quantity Supplied 2 4 6 8 10 12 14 16 18 20 36 32 28 24 20 16 12 8 4 0 12 14 16 18 20 22 24 26 28 30 Draw and upload a graph of the electricity market described in the table. Be sure to label your axes and ensure that the supply and demand curves express the price/quantity relationships described in the table. Identify the equilibrium in this market. You must add numeric labels to the axis in order to show the curves and equilibrium accurately.

Microeconomics: Principles & Policy
14th Edition
ISBN:9781337794992
Author:William J. Baumol, Alan S. Blinder, John L. Solow
Publisher:William J. Baumol, Alan S. Blinder, John L. Solow
Chapter4: Supply And Demand: An Initial Look
Section: Chapter Questions
Problem 3TY

Related questions
Question
Transcribed Image Text:The supply and demand schedules for a local electric utility are as
follows in the table below. The price is in cents per kilowatt hour
(kWh), and the quantities are in millions of kilowatt hours.
Price Quantity Demanded Quantity Supplied
2
4
6
8
10
12
14
16
18
20
36
32
28
24
20
16
12
8
4
0
12
14
16
18
20
22
24
26
28
30
Draw and upload a graph of the electricity market described in the table.
Be sure to label your axes and ensure that the supply and demand curves
express the price/quantity relationships described in the table. Identify
the equilibrium in this market.
You must add numeric labels to the axis in order to show the curves and
equilibrium accurately.
Expert Solution
This question has been solved!
Explore an expertly crafted, step-by-step solution for a thorough understanding of key concepts.

This is a popular solution!

Trending now
This is a popular solution!

Step by step
Solved in 3 steps with 2 images

Knowledge Booster


Learn more about
Need a deep-dive on the concept behind this application? Look no further. Learn more about this topic, economics and related others by exploring similar questions and additional content below.Recommended textbooks for you
Microeconomics: Principles & Policy
Economics
ISBN:
9781337794992
Author:
William J. Baumol, Alan S. Blinder, John L. Solow
Publisher:
Cengage Learning


Economics (MindTap Course List)
Economics
ISBN:
9781337617383
Author:
Roger A. Arnold
Publisher:
Cengage Learning
Microeconomics: Principles & Policy
Economics
ISBN:
9781337794992
Author:
William J. Baumol, Alan S. Blinder, John L. Solow
Publisher:
Cengage Learning
Economics (MindTap Course List)
Economics
ISBN:
9781337617383
Author:
Roger A. Arnold
Publisher:
Cengage Learning


Exploring Economics
Economics
ISBN:
9781544336329
Author:
Robert L. Sexton
Publisher:
SAGE Publications, Inc
