The table below gives the annual sales (in millions) of a product. year 1998 1999 2000 2001 2002 2003 2004 2005 2006 sales 255 300 335 360 375 380 375 360 335 What was the average rate of change of annual sales a) between 2003 and 2004? Select an answer b) between 2003 and 2005? Select an answer >
The table below gives the annual sales (in millions) of a product. year 1998 1999 2000 2001 2002 2003 2004 2005 2006 sales 255 300 335 360 375 380 375 360 335 What was the average rate of change of annual sales a) between 2003 and 2004? Select an answer b) between 2003 and 2005? Select an answer >

Chapter3: Functions
Section3.3: Rates Of Change And Behavior Of Graphs
Problem 27SE: Table 4 gives the population of a town (in thousand) from 2000 to 2008. What was the average rate of...

Related questions
Question
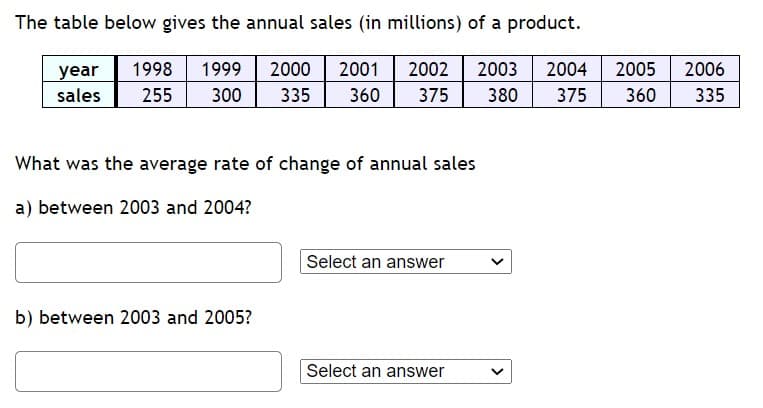
Transcribed Image Text:The table below gives the annual sales (in millions) of a product.
year
1998
1999
2000
2001
2002
2003
2004
2005
2006
sales
255
300
335
360
375
380
375
360
335
What was the average rate of change of annual sales
a) between 2003 and 2004?
Select an answer
b) between 2003 and 2005?
Select an answer
Expert Solution
This question has been solved!
Explore an expertly crafted, step-by-step solution for a thorough understanding of key concepts.

This is a popular solution!

Trending now
This is a popular solution!

Step by step
Solved in 2 steps with 2 images

Recommended textbooks for you

Algebra & Trigonometry with Analytic Geometry
Algebra
ISBN:
9781133382119
Author:
Swokowski
Publisher:
Cengage

Glencoe Algebra 1, Student Edition, 9780079039897…
Algebra
ISBN:
9780079039897
Author:
Carter
Publisher:
McGraw Hill
Algebra & Trigonometry with Analytic Geometry
Algebra
ISBN:
9781133382119
Author:
Swokowski
Publisher:
Cengage
Glencoe Algebra 1, Student Edition, 9780079039897…
Algebra
ISBN:
9780079039897
Author:
Carter
Publisher:
McGraw Hill


Trigonometry (MindTap Course List)
Trigonometry
ISBN:
9781337278461
Author:
Ron Larson
Publisher:
Cengage Learning

Big Ideas Math A Bridge To Success Algebra 1: Stu…
Algebra
ISBN:
9781680331141
Author:
HOUGHTON MIFFLIN HARCOURT
Publisher:
Houghton Mifflin Harcourt